 mooMON
User Guide
A practical walk through every part of mooMON — from your first connection to live monitoring, SQL, schema work, scheduling and OLAP. Each screen is shown as you'll see it.
Connecting
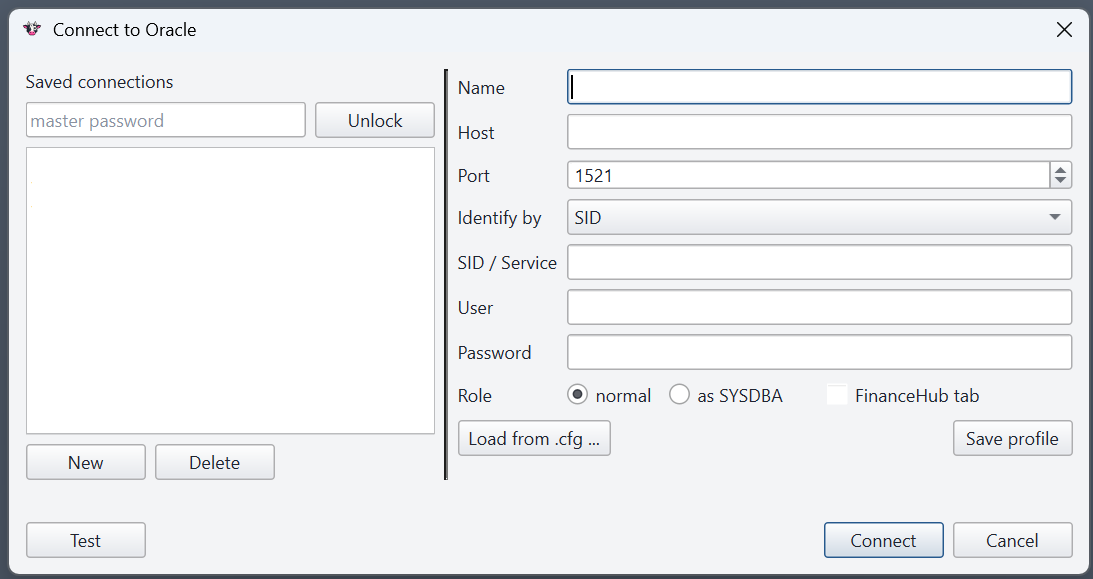
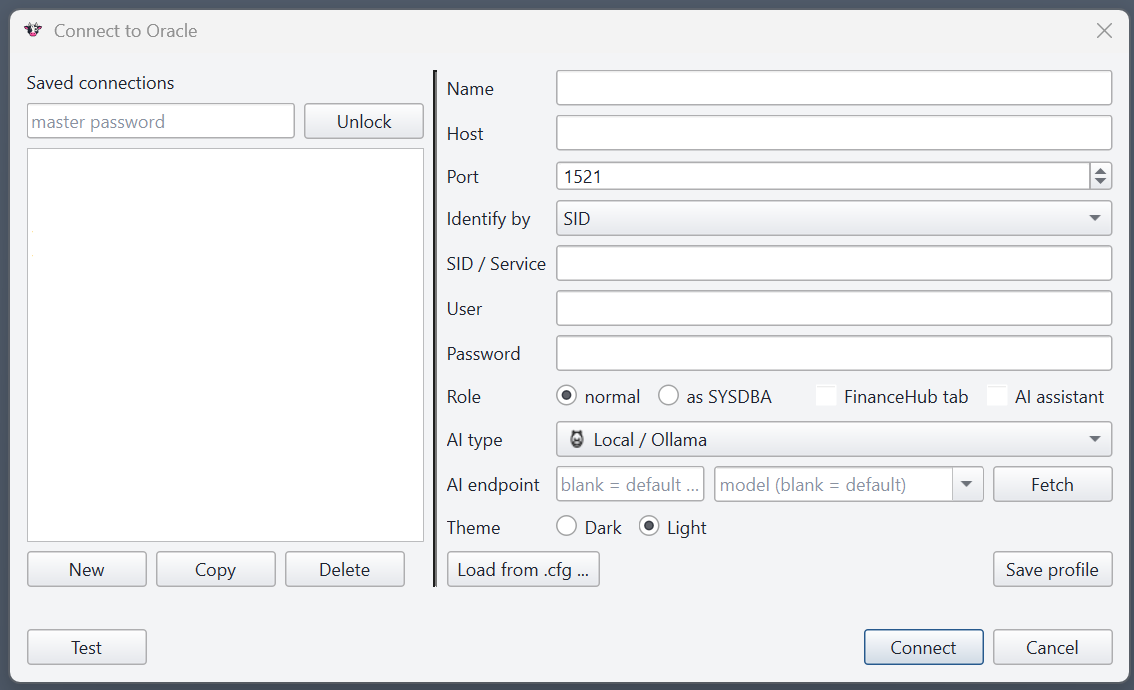
When mooMON opens, it asks where to connect. Fill in the host, port and service (or SID), your username and password, and choose a role. Tick as SYSDBA for an administrative login. Test checks the connection without opening a session.
Saved profiles
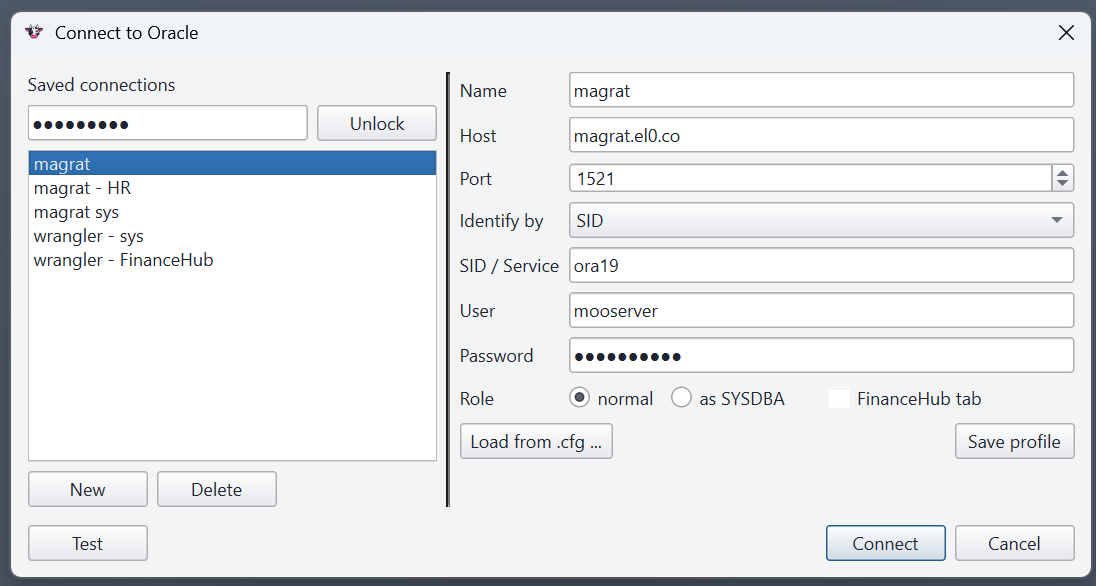
Connections you use often can be saved as named profiles. Enter a master password once to
unlock them; passwords are stored encrypted in ~/.moomon/connections.json, never
in plain text. Select a profile to load its details, then Connect.
Environment colour
Give each connection a soft colour — production red, staging amber, development green — and mooMON paints a gentle halo around the window and a swatch row in the status bar. It's a memory aid you set, remembered per login, so production always comes up wearing its colour.
Several sessions at once
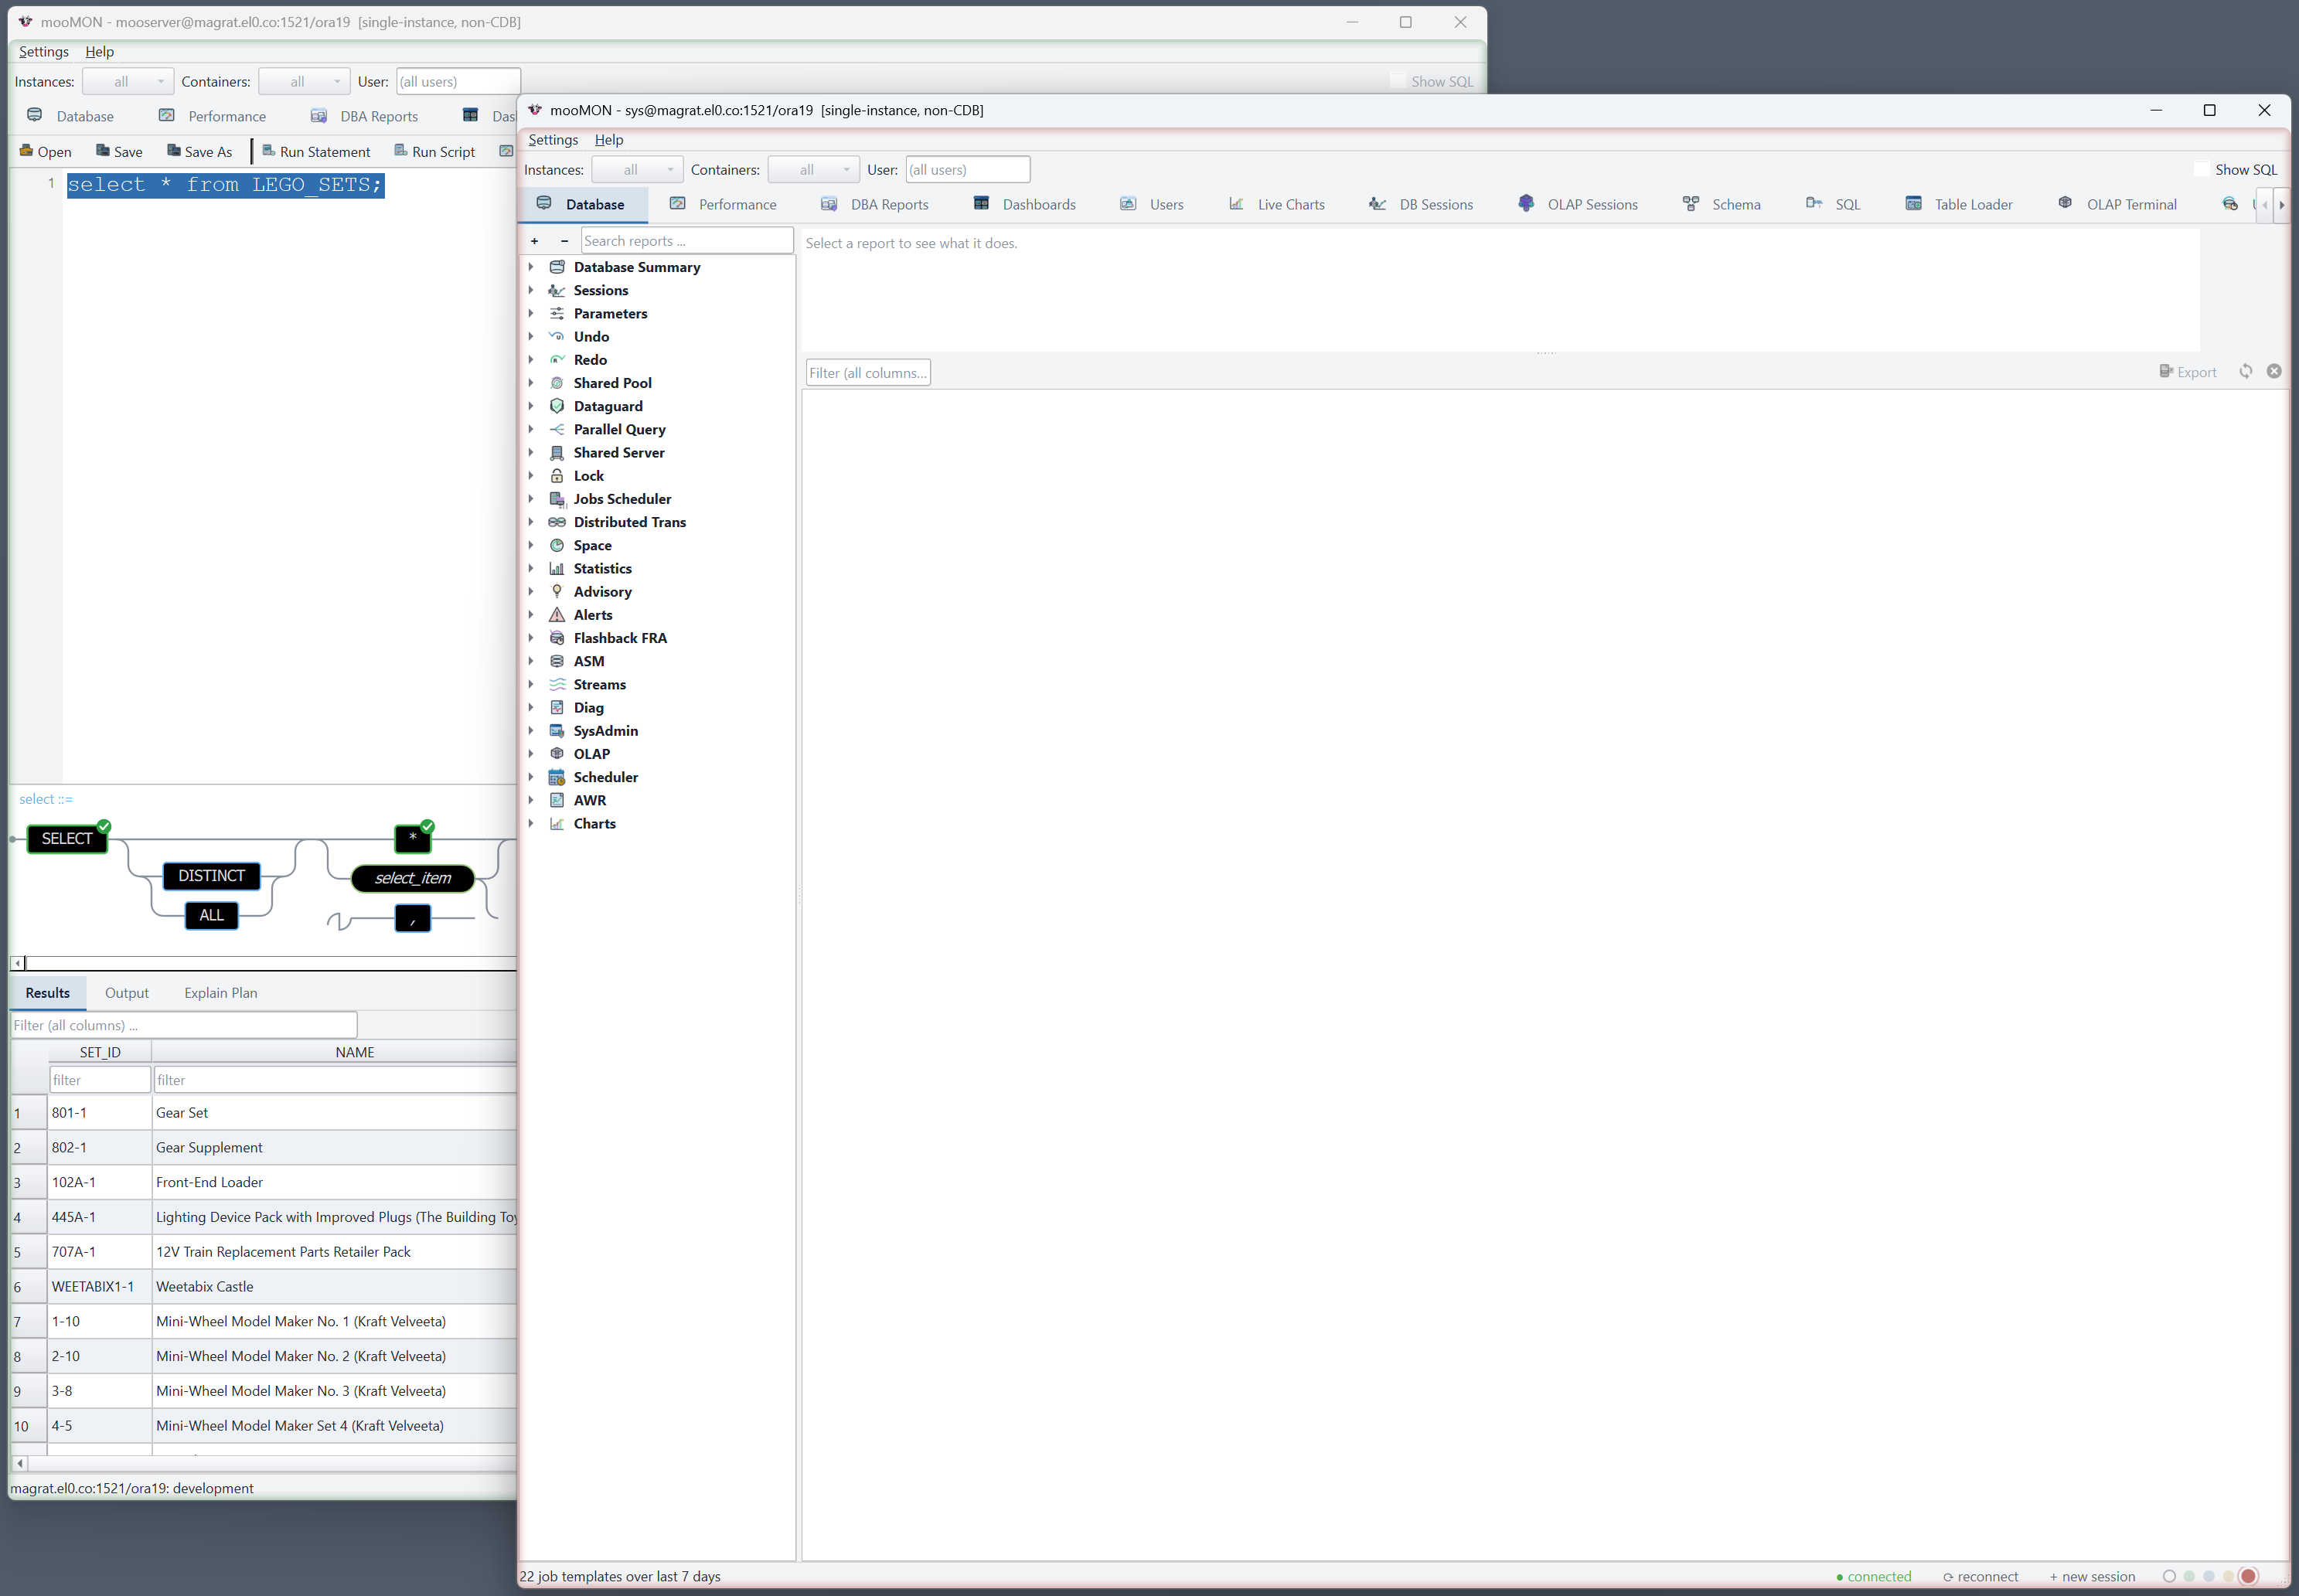
Use New session on the status bar to open another database in a second window, without closing the first — two databases, or two logins, worked side by side. Reconnect replaces a stale session using the same profile.
Preferences & settings
The Settings menu holds mooMON's preferences. Switch between the light and dark
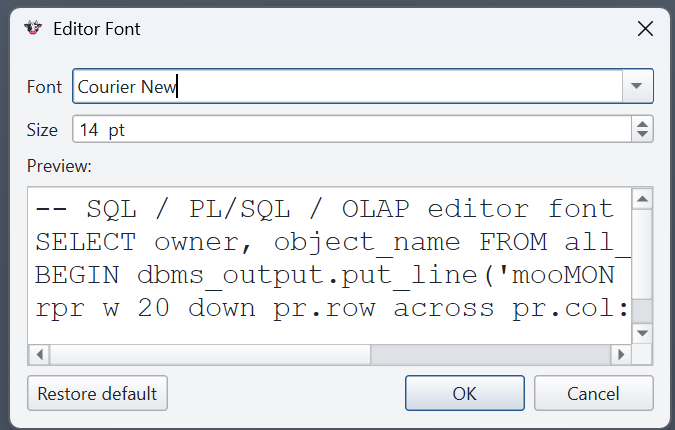
themes, set the editor font used by the SQL and OLAP panes, and open a new
scratchpad or a new OLAP terminal. Your choices are remembered per user in
~/.moomon/.
Session lifecycle
The status bar shows the connection with a coloured light. If a session drops, mooMON marks it — click Reconnect (or the “session lost” indicator) to re-open it on the same profile, and the light returns to green once it's back. New session opens a second, independent window. The OLAP terminal keeps its own dedicated session and shuts its analytic workspaces down cleanly when closed, restarting the engine automatically if you run a command after a shutdown.
Tabs & navigation
mooMON's tools live along the top as tabs — Database, Performance, Dashboards, Users, Live Charts, DB Sessions, OLAP Sessions, Schema, SQL, Table Loader, OLAP Terminal, Undo Monitor, Scheduler and Job History (plus FinanceHub where licensed).
Under Database and Performance, reports are organised into groups in the left pane — sessions, undo, redo, the shared pool, dataguard, ASM, AWR and more. Select a report to run it; its description and source objects are shown above the grid.
The filter bar
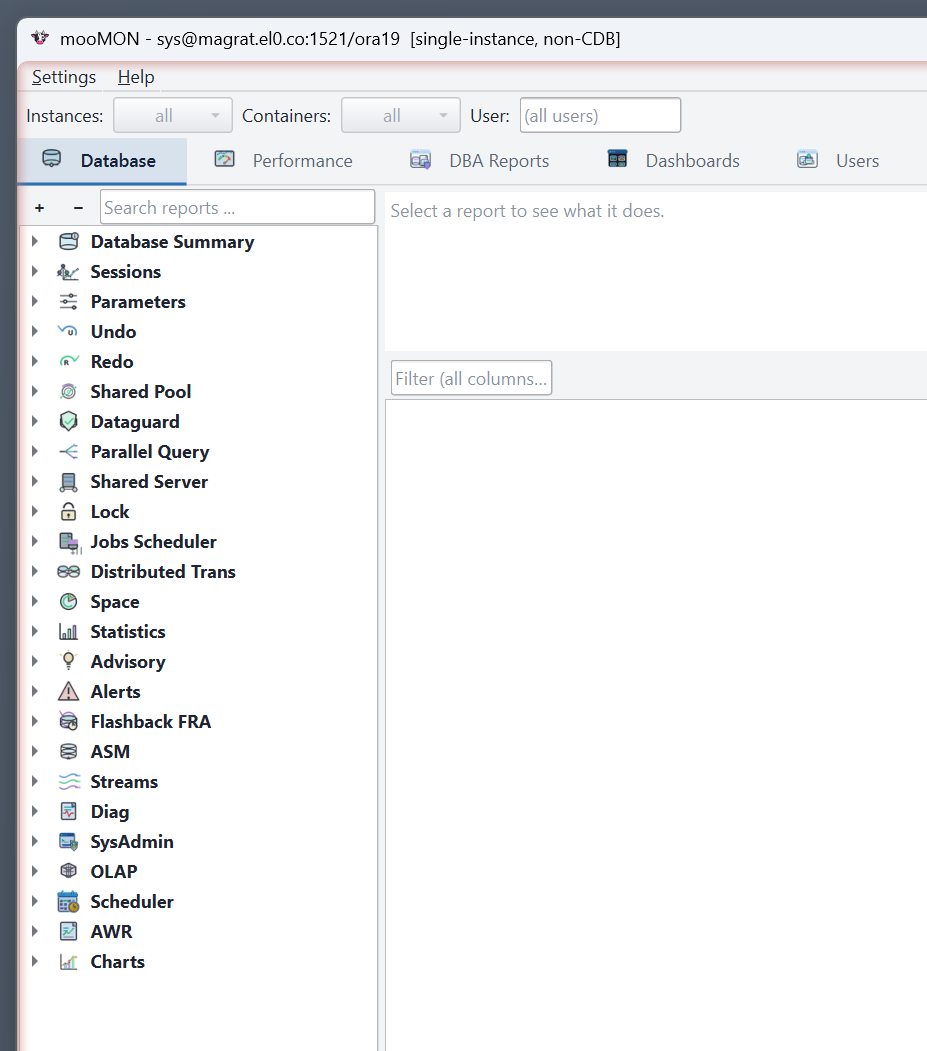
The strip along the top scopes what the monitoring panels show. Narrow to specific RAC instances or containers, filter by database user, and toggle Show SQL to reveal the exact statement each report runs.
Working with grids
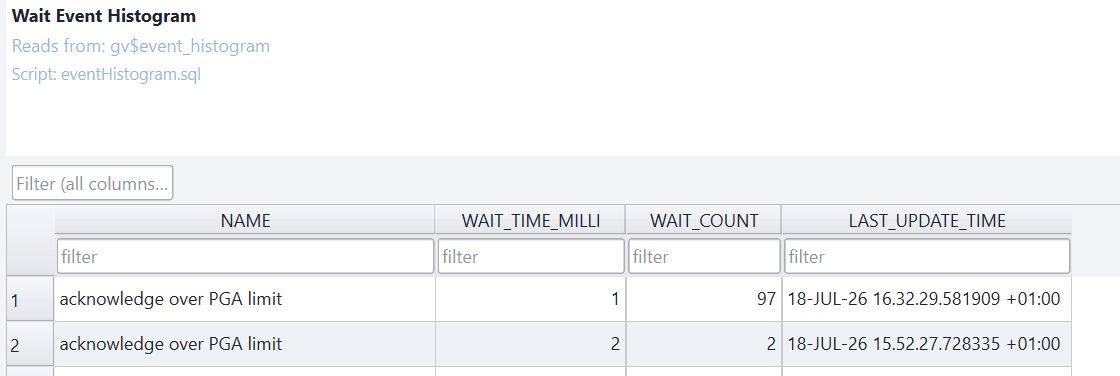
Every report renders in a fast, sortable grid. Type into the per-column filter row to narrow results instantly; click a header to sort. Grids stay responsive on large result sets.

Drill-down
Right-click a row that carries a SQL_ID or a wait event to open an AWR/ASH detail
report for that exact value — it opens in its own pop-out tab, so the report you came from
stays put.
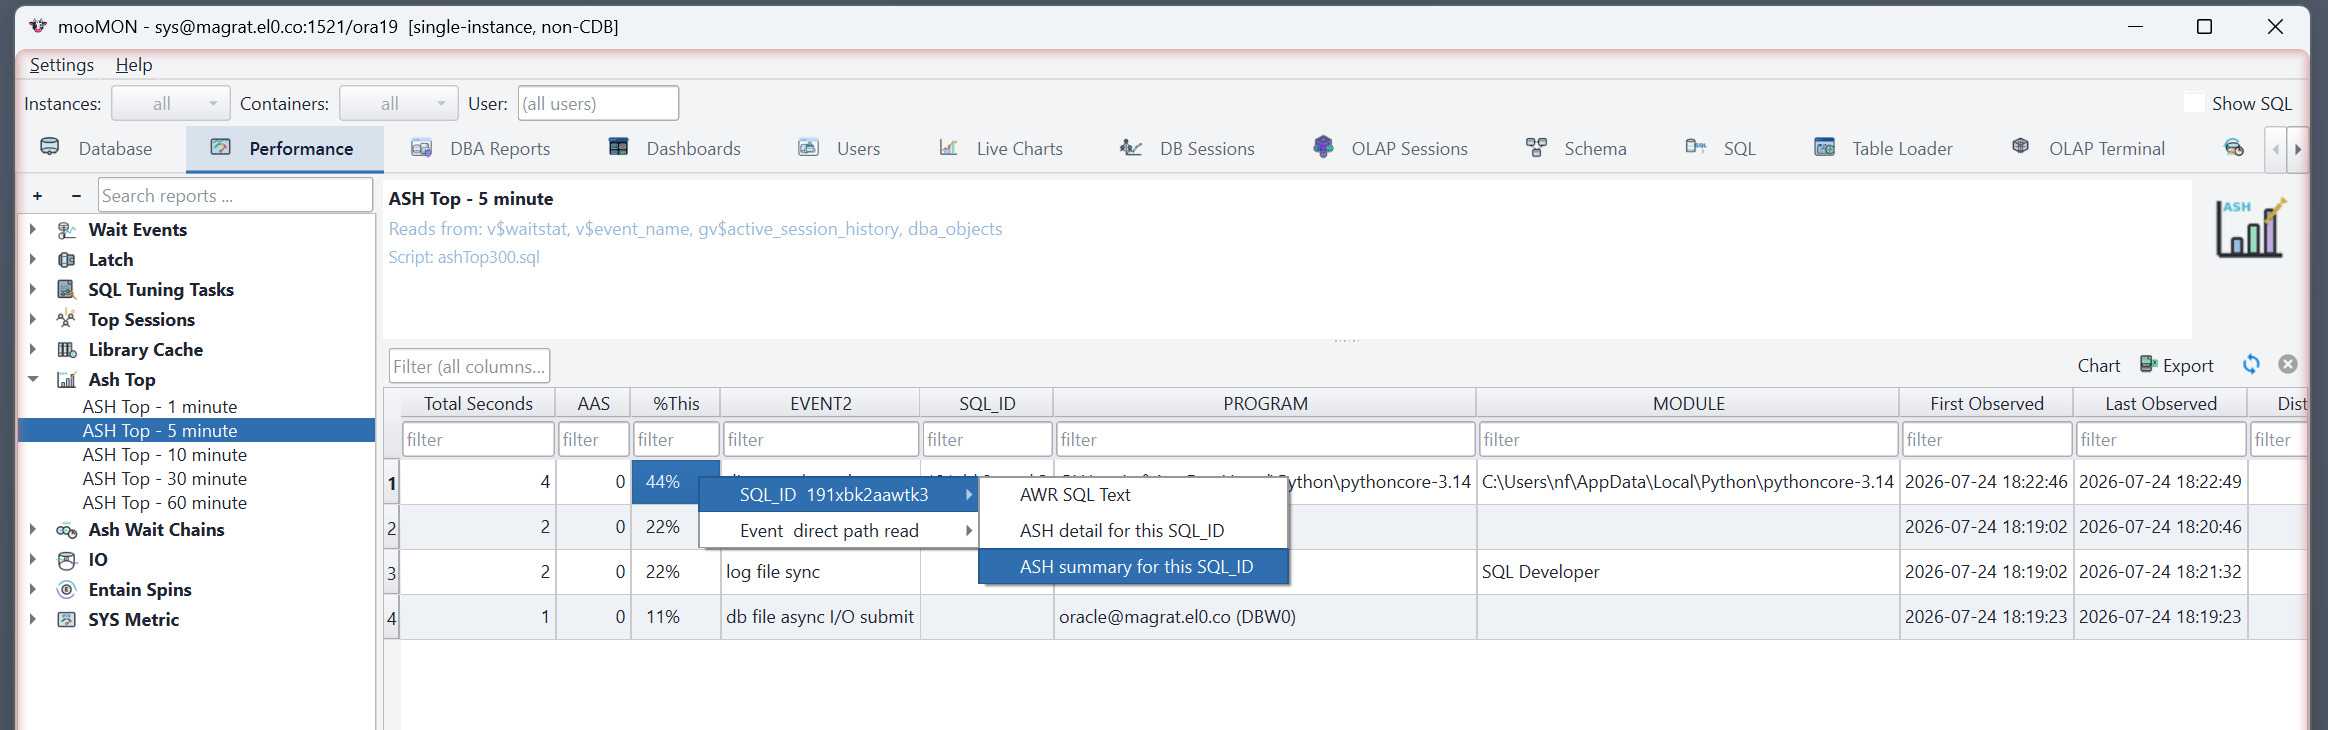
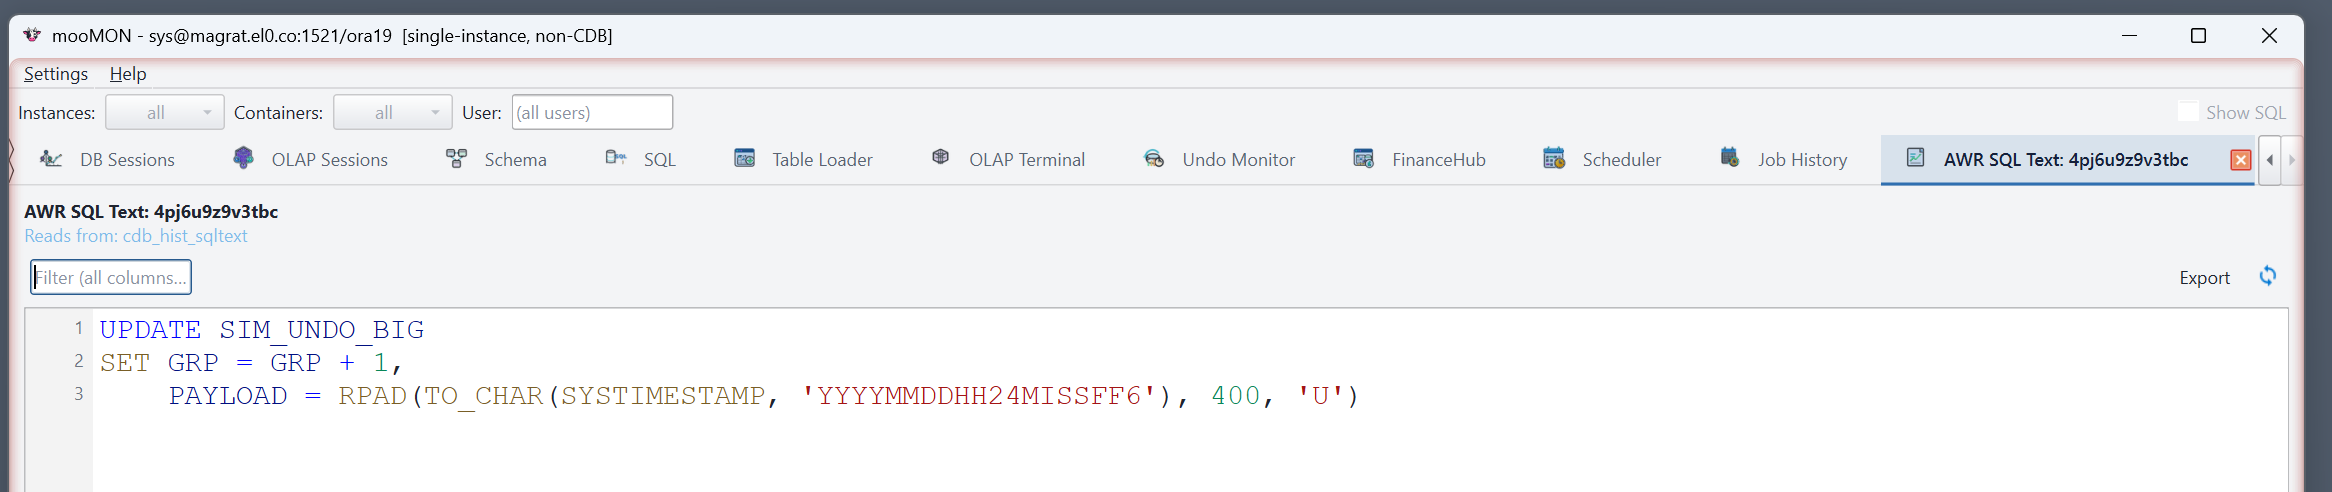
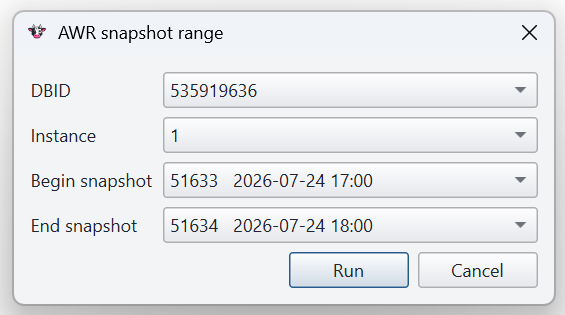
Where a report needs an AWR snapshot range, mooMON asks for it first, then inherits that range for any further drills.
Exporting
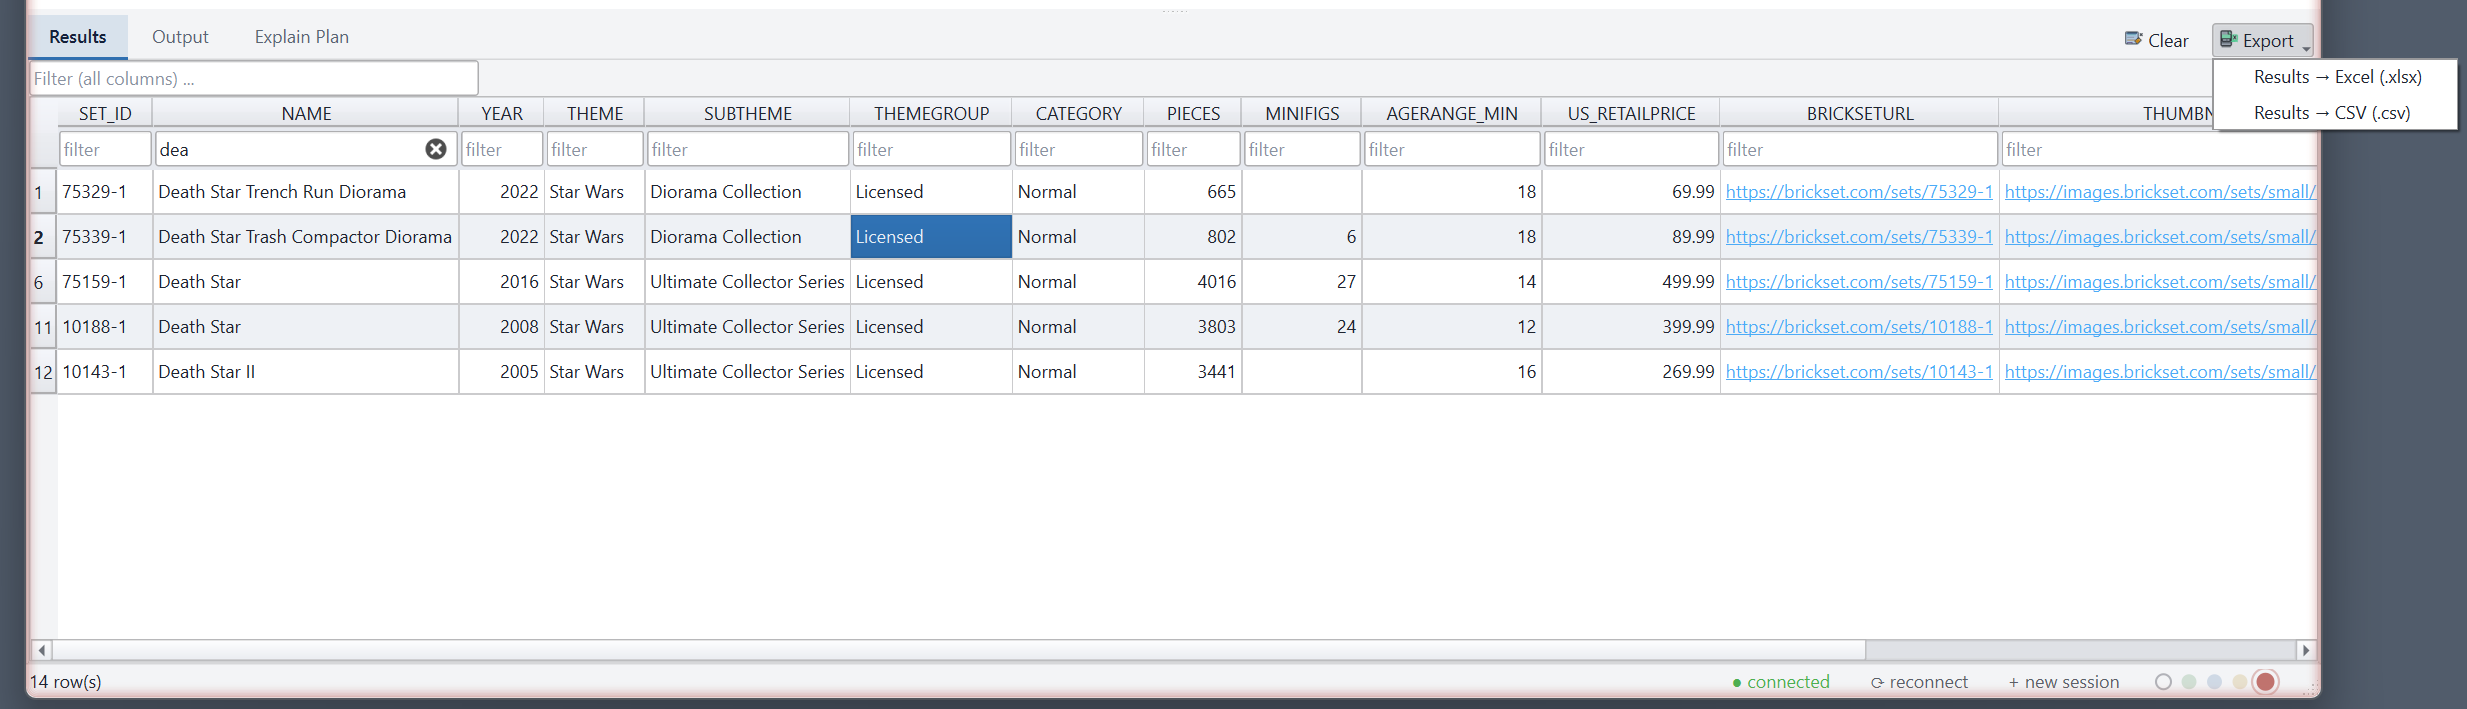
The Export button sends the current result to Excel (.xlsx)
or CSV; dashboards can also be saved as SVG or PNG.
The report library at a glance
Under Database and Performance, hundreds of diagnostic reports are grouped by subsystem. You don't have to learn them — select a group, run a report, read its description above the grid, then filter, drill or export. The groups show the breadth of coverage:
| Database | Performance |
|---|---|
| Sessions · Locks · Undo · Redo · Shared Pool | Wait Events · Latches · Library Cache |
| Parameters · Statistics · Advisory | Top Sessions · ASH Top · ASH Wait Chains |
| Space · ASM · Flashback / FRA | I/O · SQL Tuning Tasks · SYS Metric |
| Data Guard · Parallel Query · Shared Server | |
| Distributed Txns · Streams · Diag / incidents | |
| Jobs / Scheduler · OLAP · AWR (≈90 reports) |
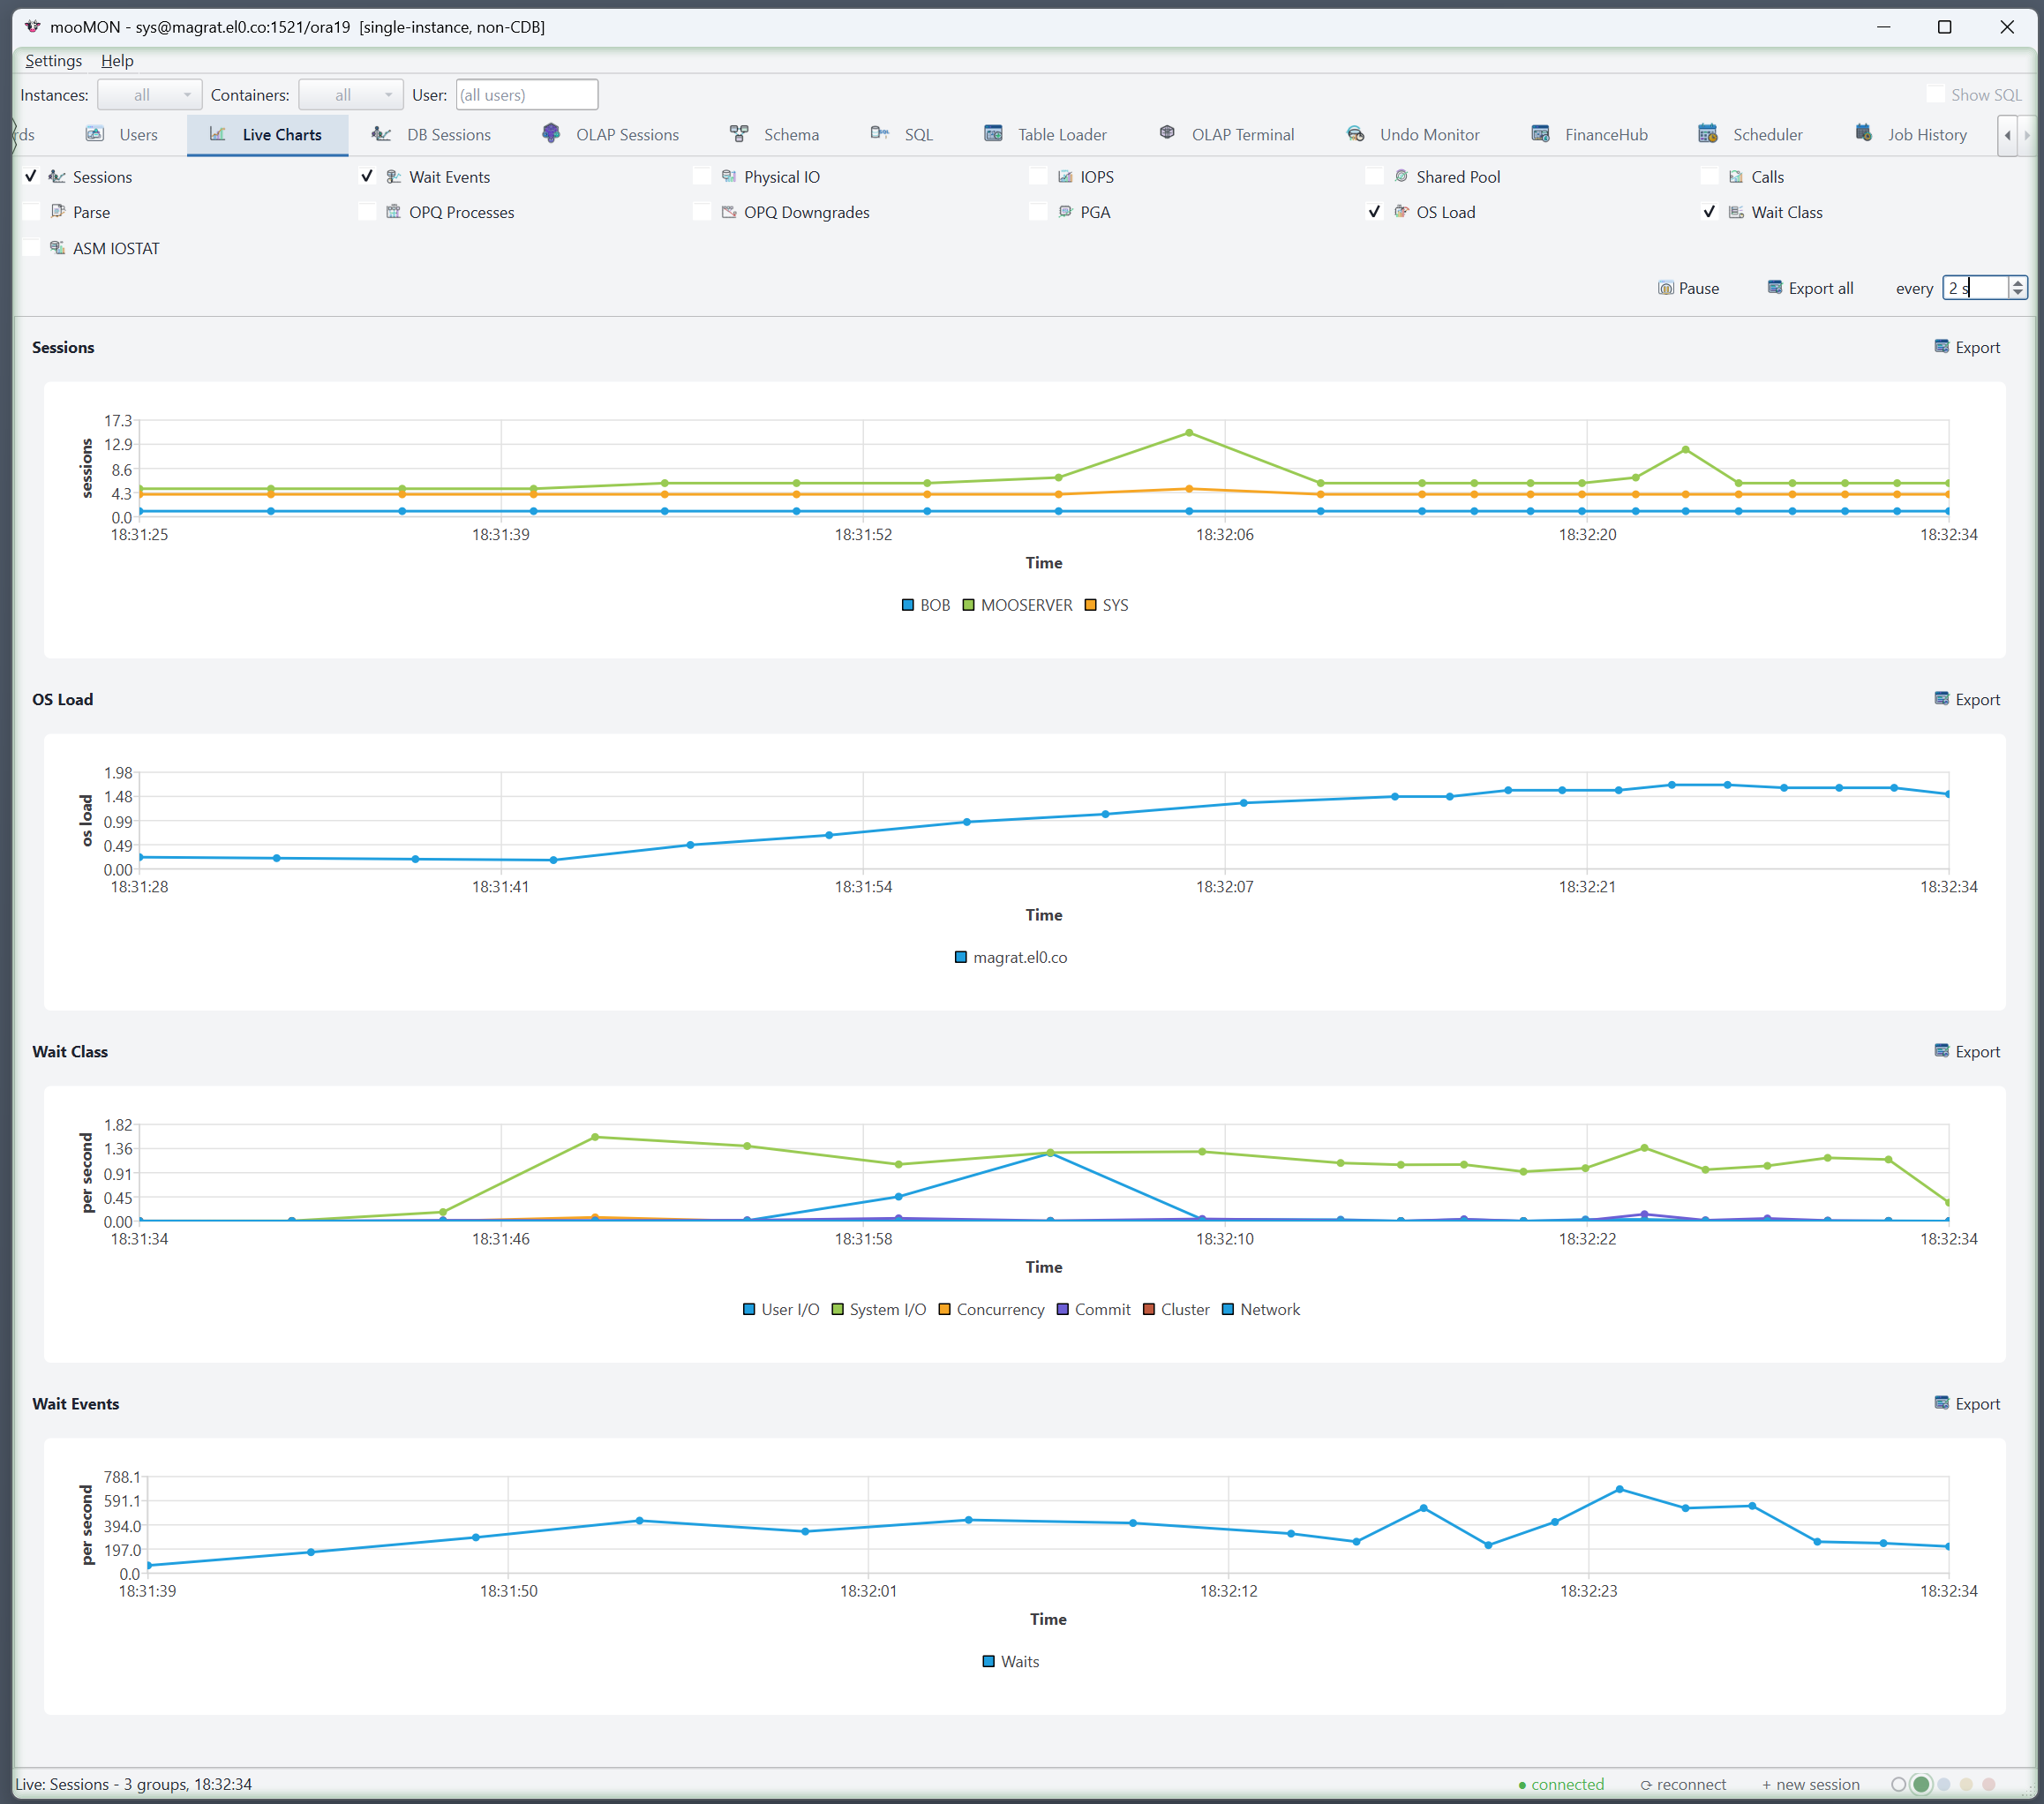
Live Charts
RichMon-style live monitoring: tick the metrics you want and watch them plot in real time from
the gv$ views. Leave it running to build history before you read the trend.
Instance Viewer
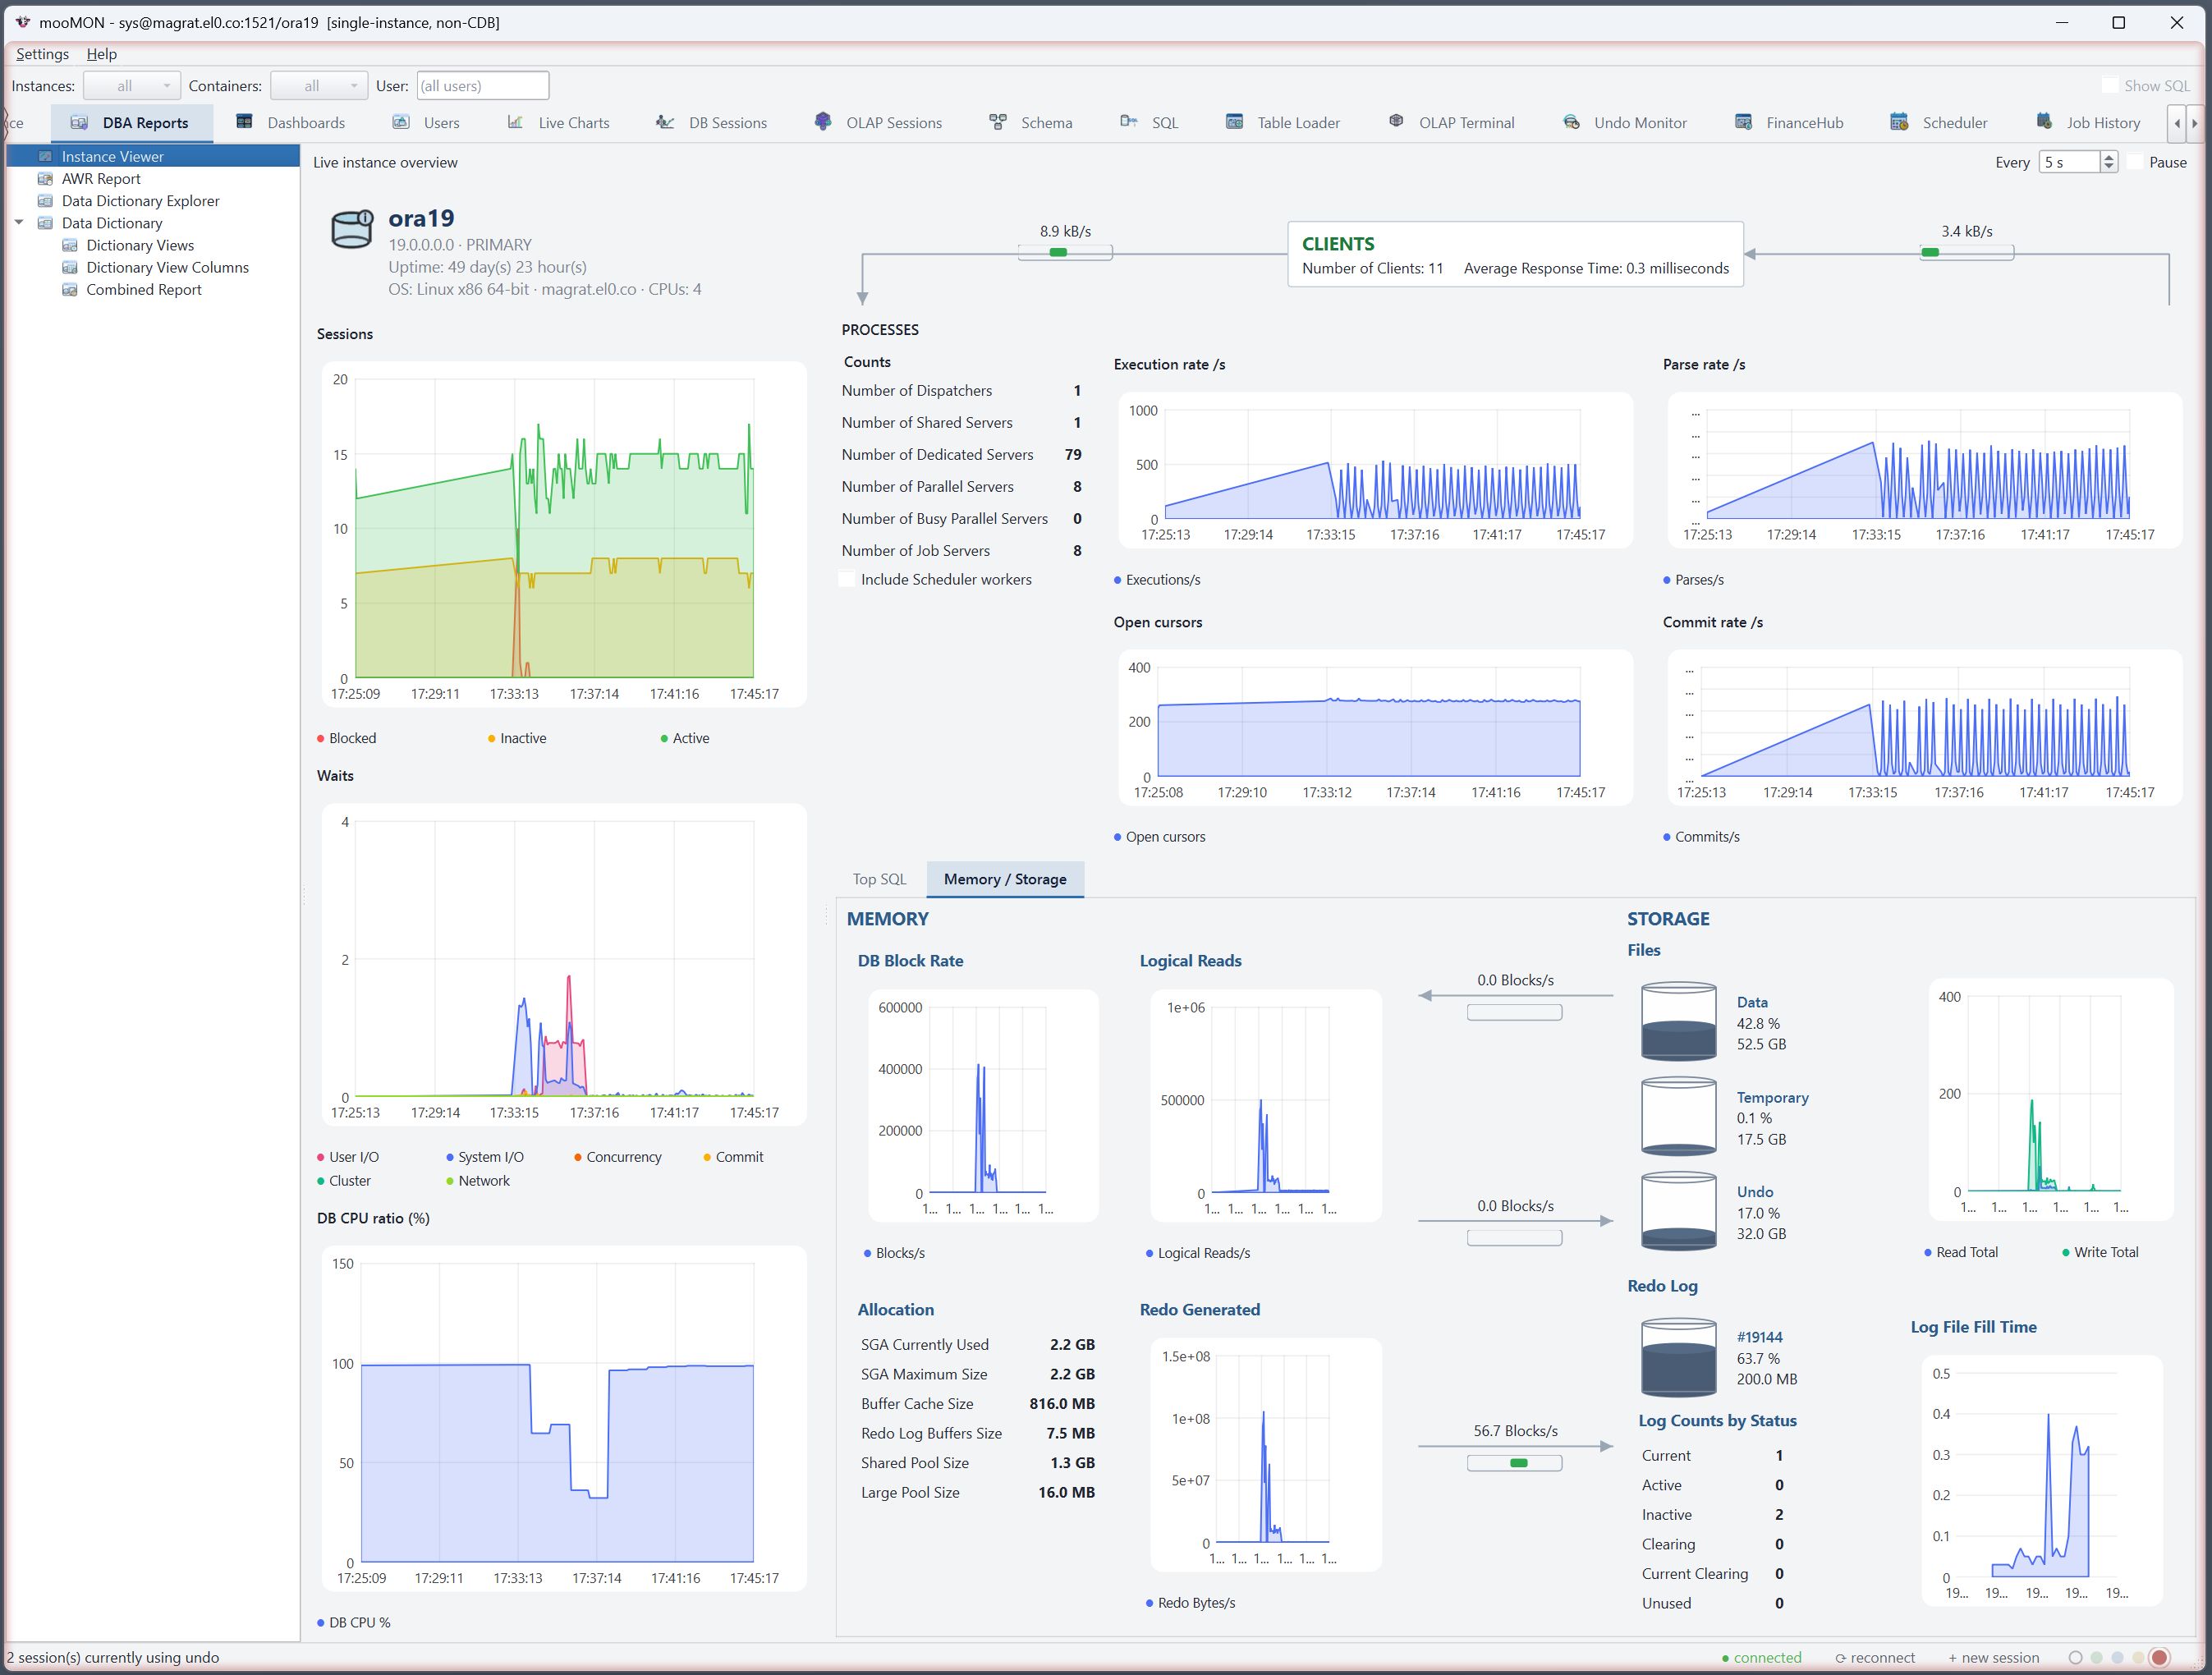
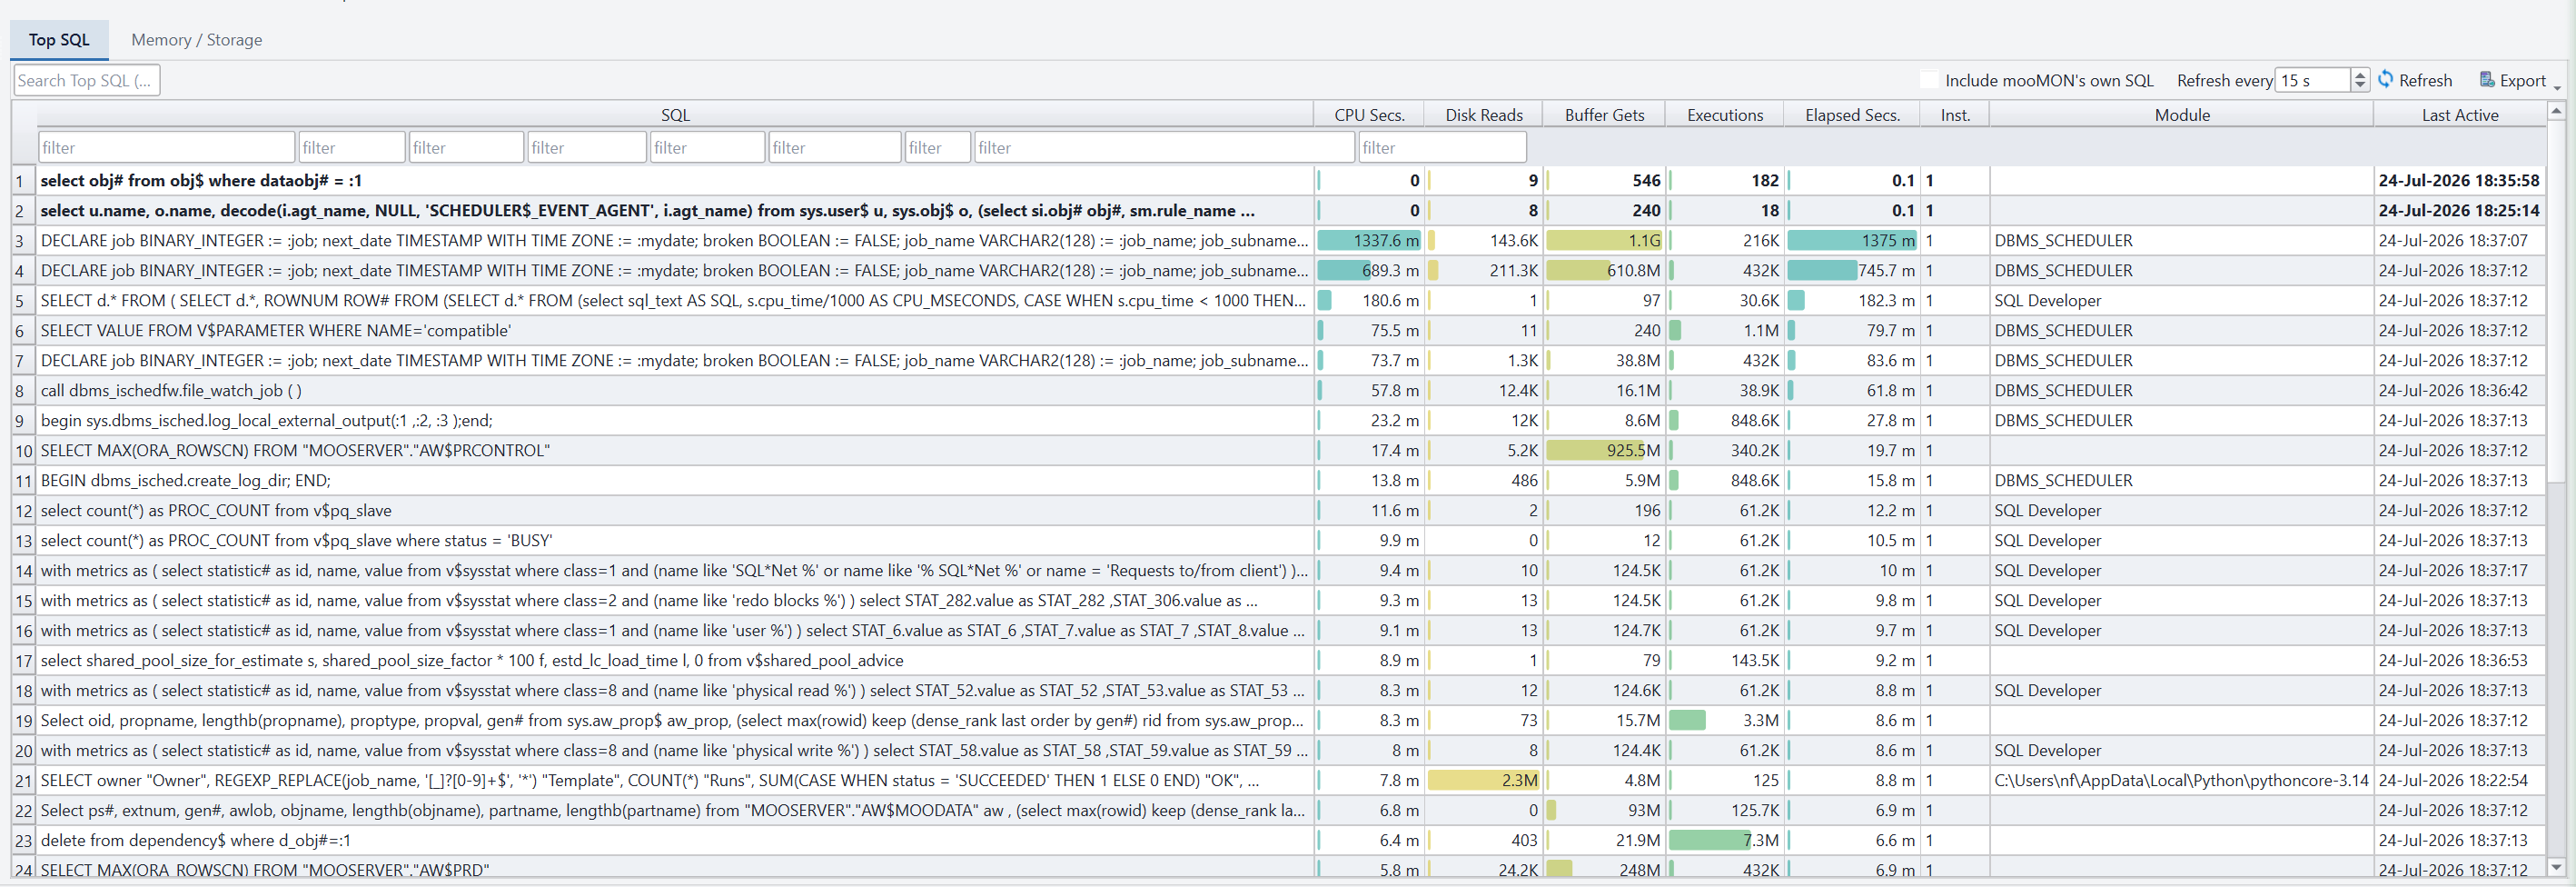
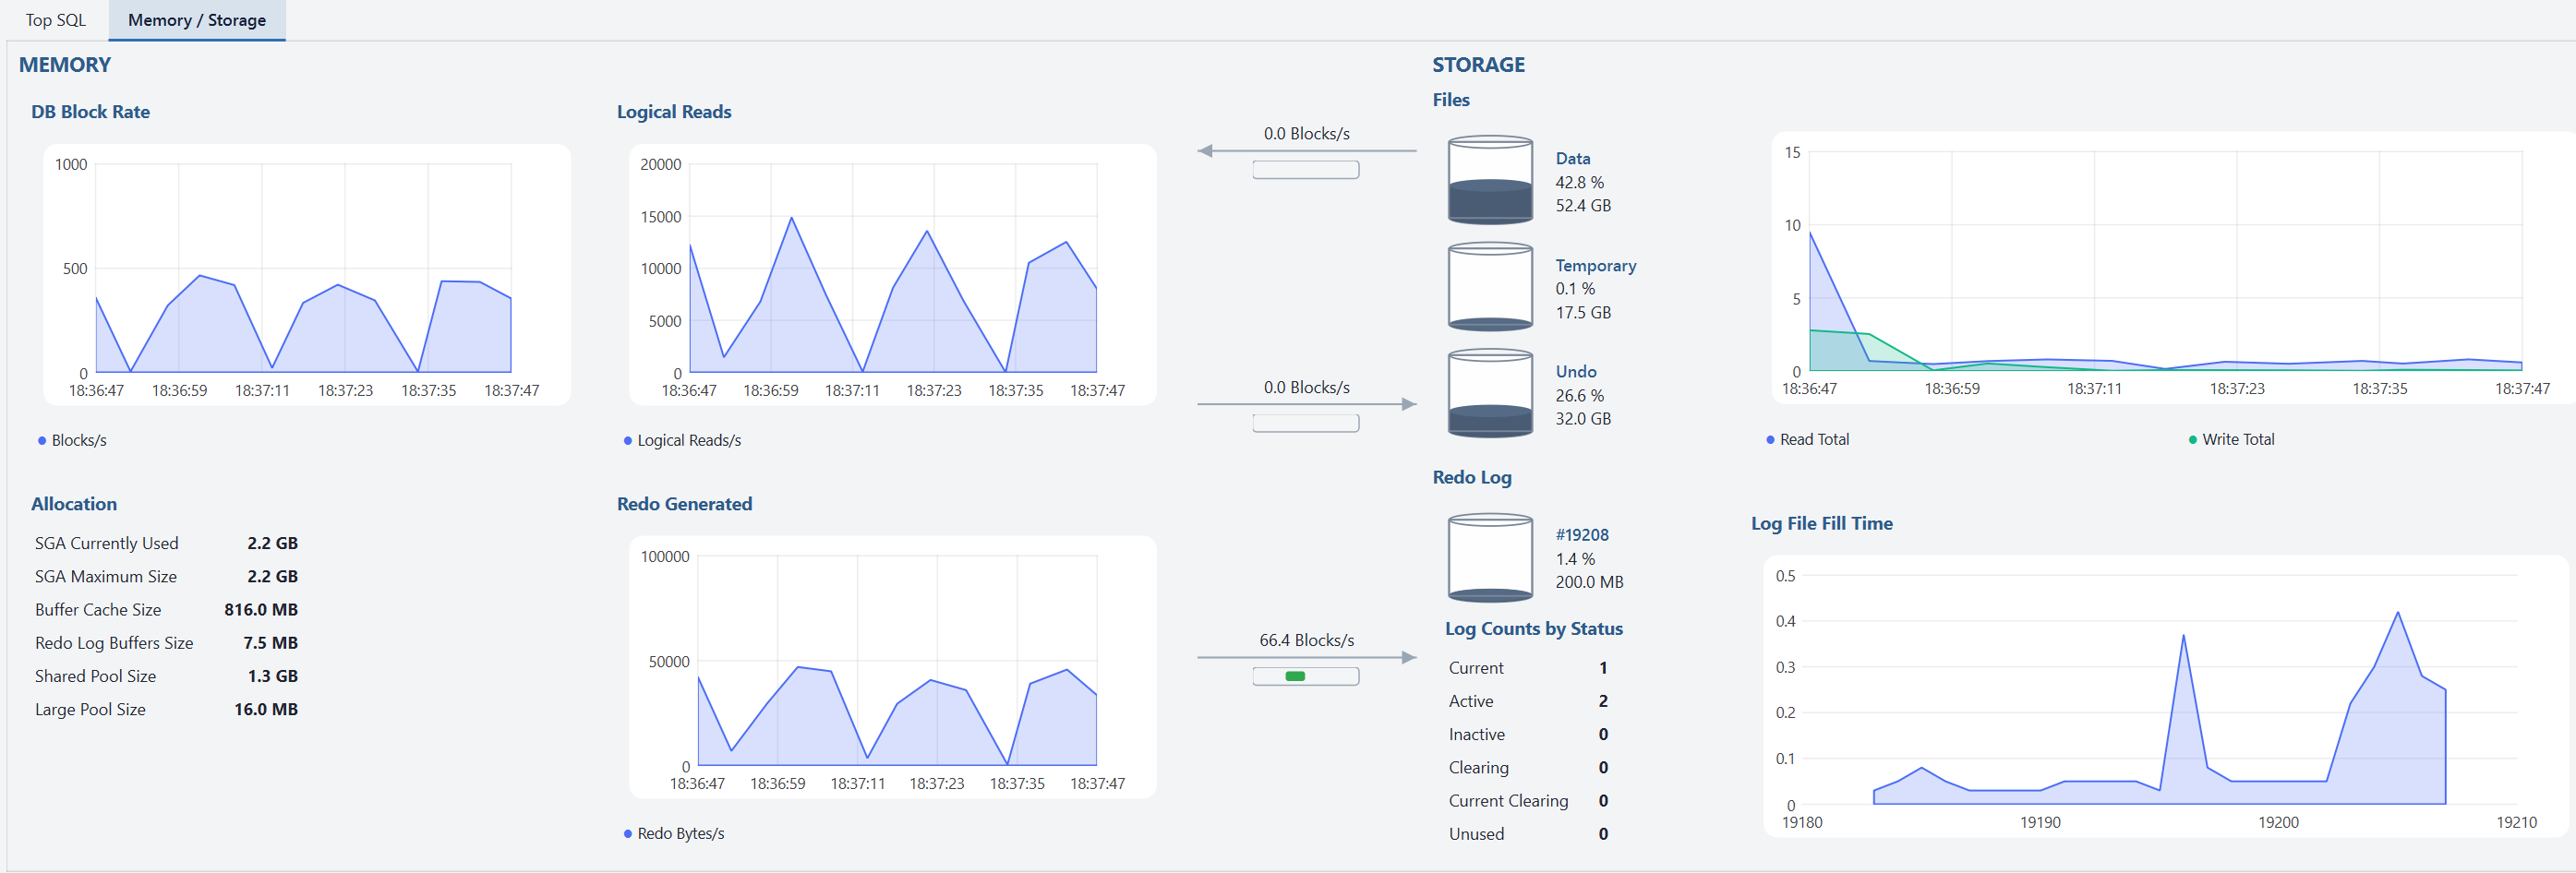
A single live page for one database instance: header vitals, live charts for CPU, sessions, waits, I/O and more, client counts, Top SQL and the SGA. On a RAC cluster, use the instance dropdown to focus on one node or see the whole cluster — under “All instances”, the single-metric charts draw one line per node.
DB Sessions
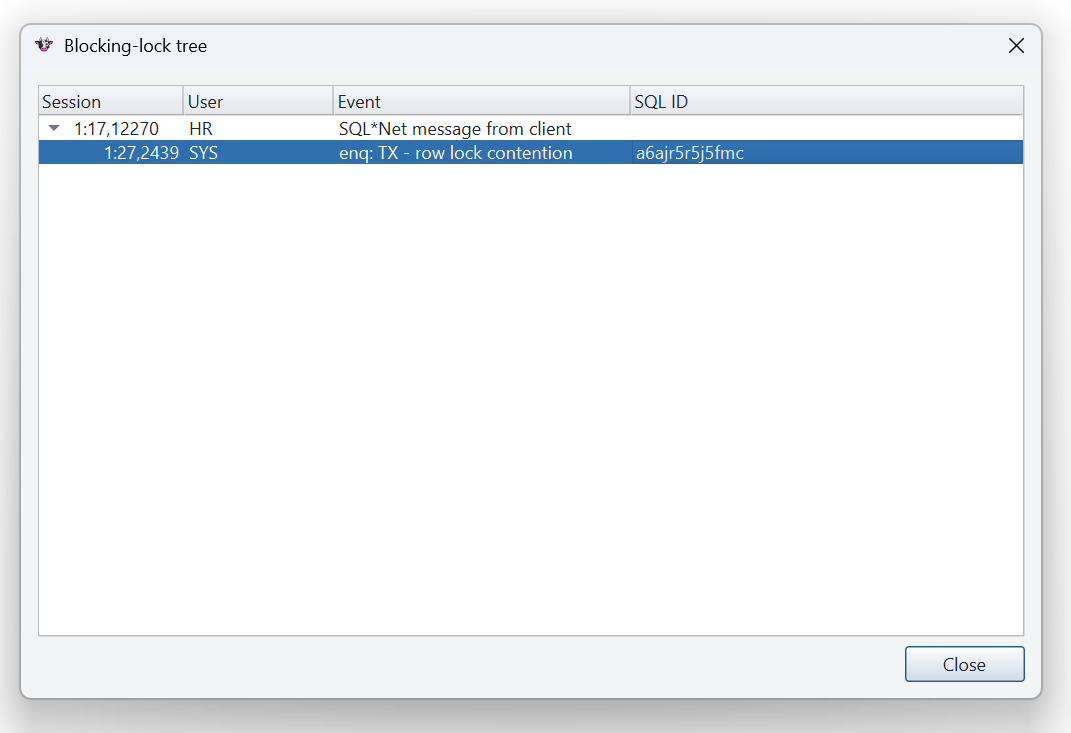
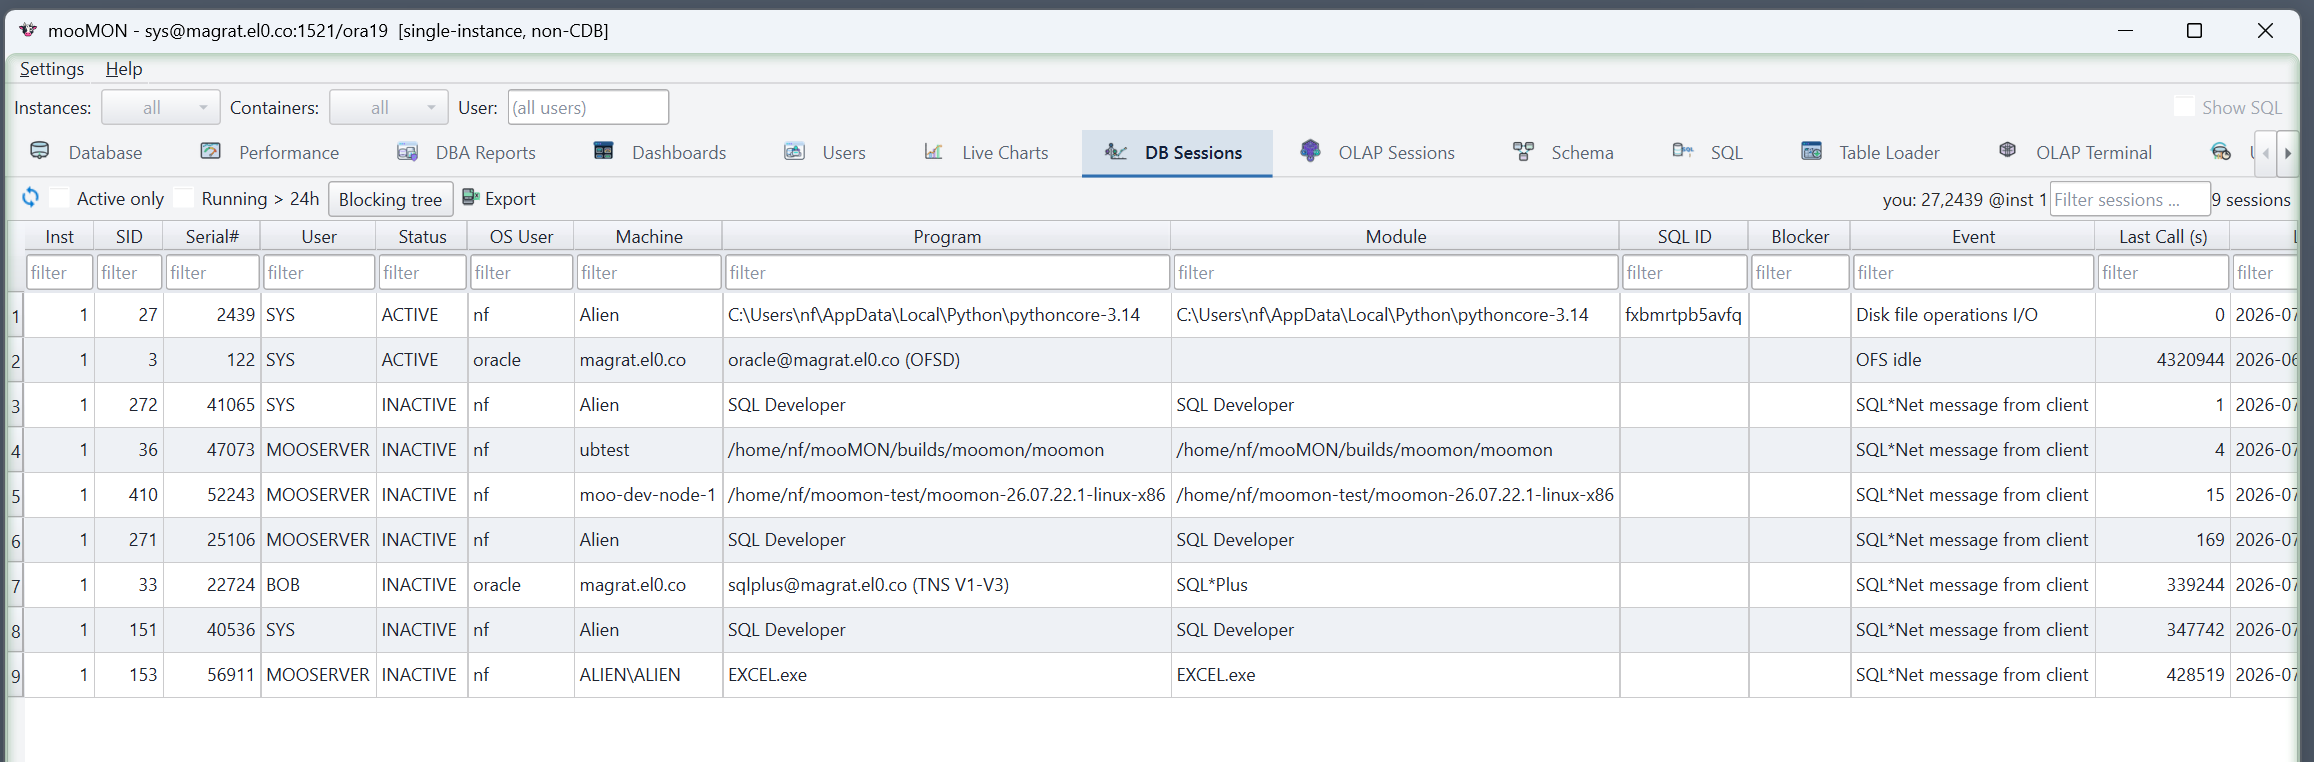
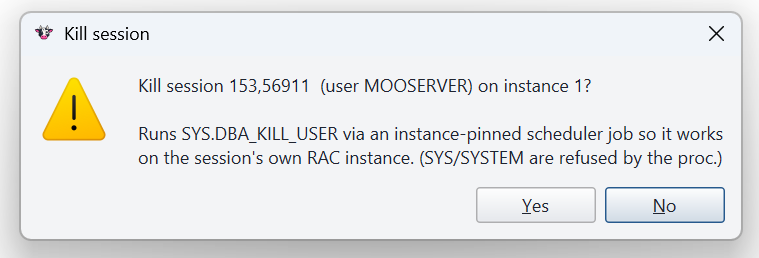
Every session in the database, with a live blocking tree that shows exactly who is waiting on whom. Filters isolate active sessions or anything running longer than 24 hours. When you need to intervene, kill or disconnect a session — with a clear confirmation first.
Undo Monitor
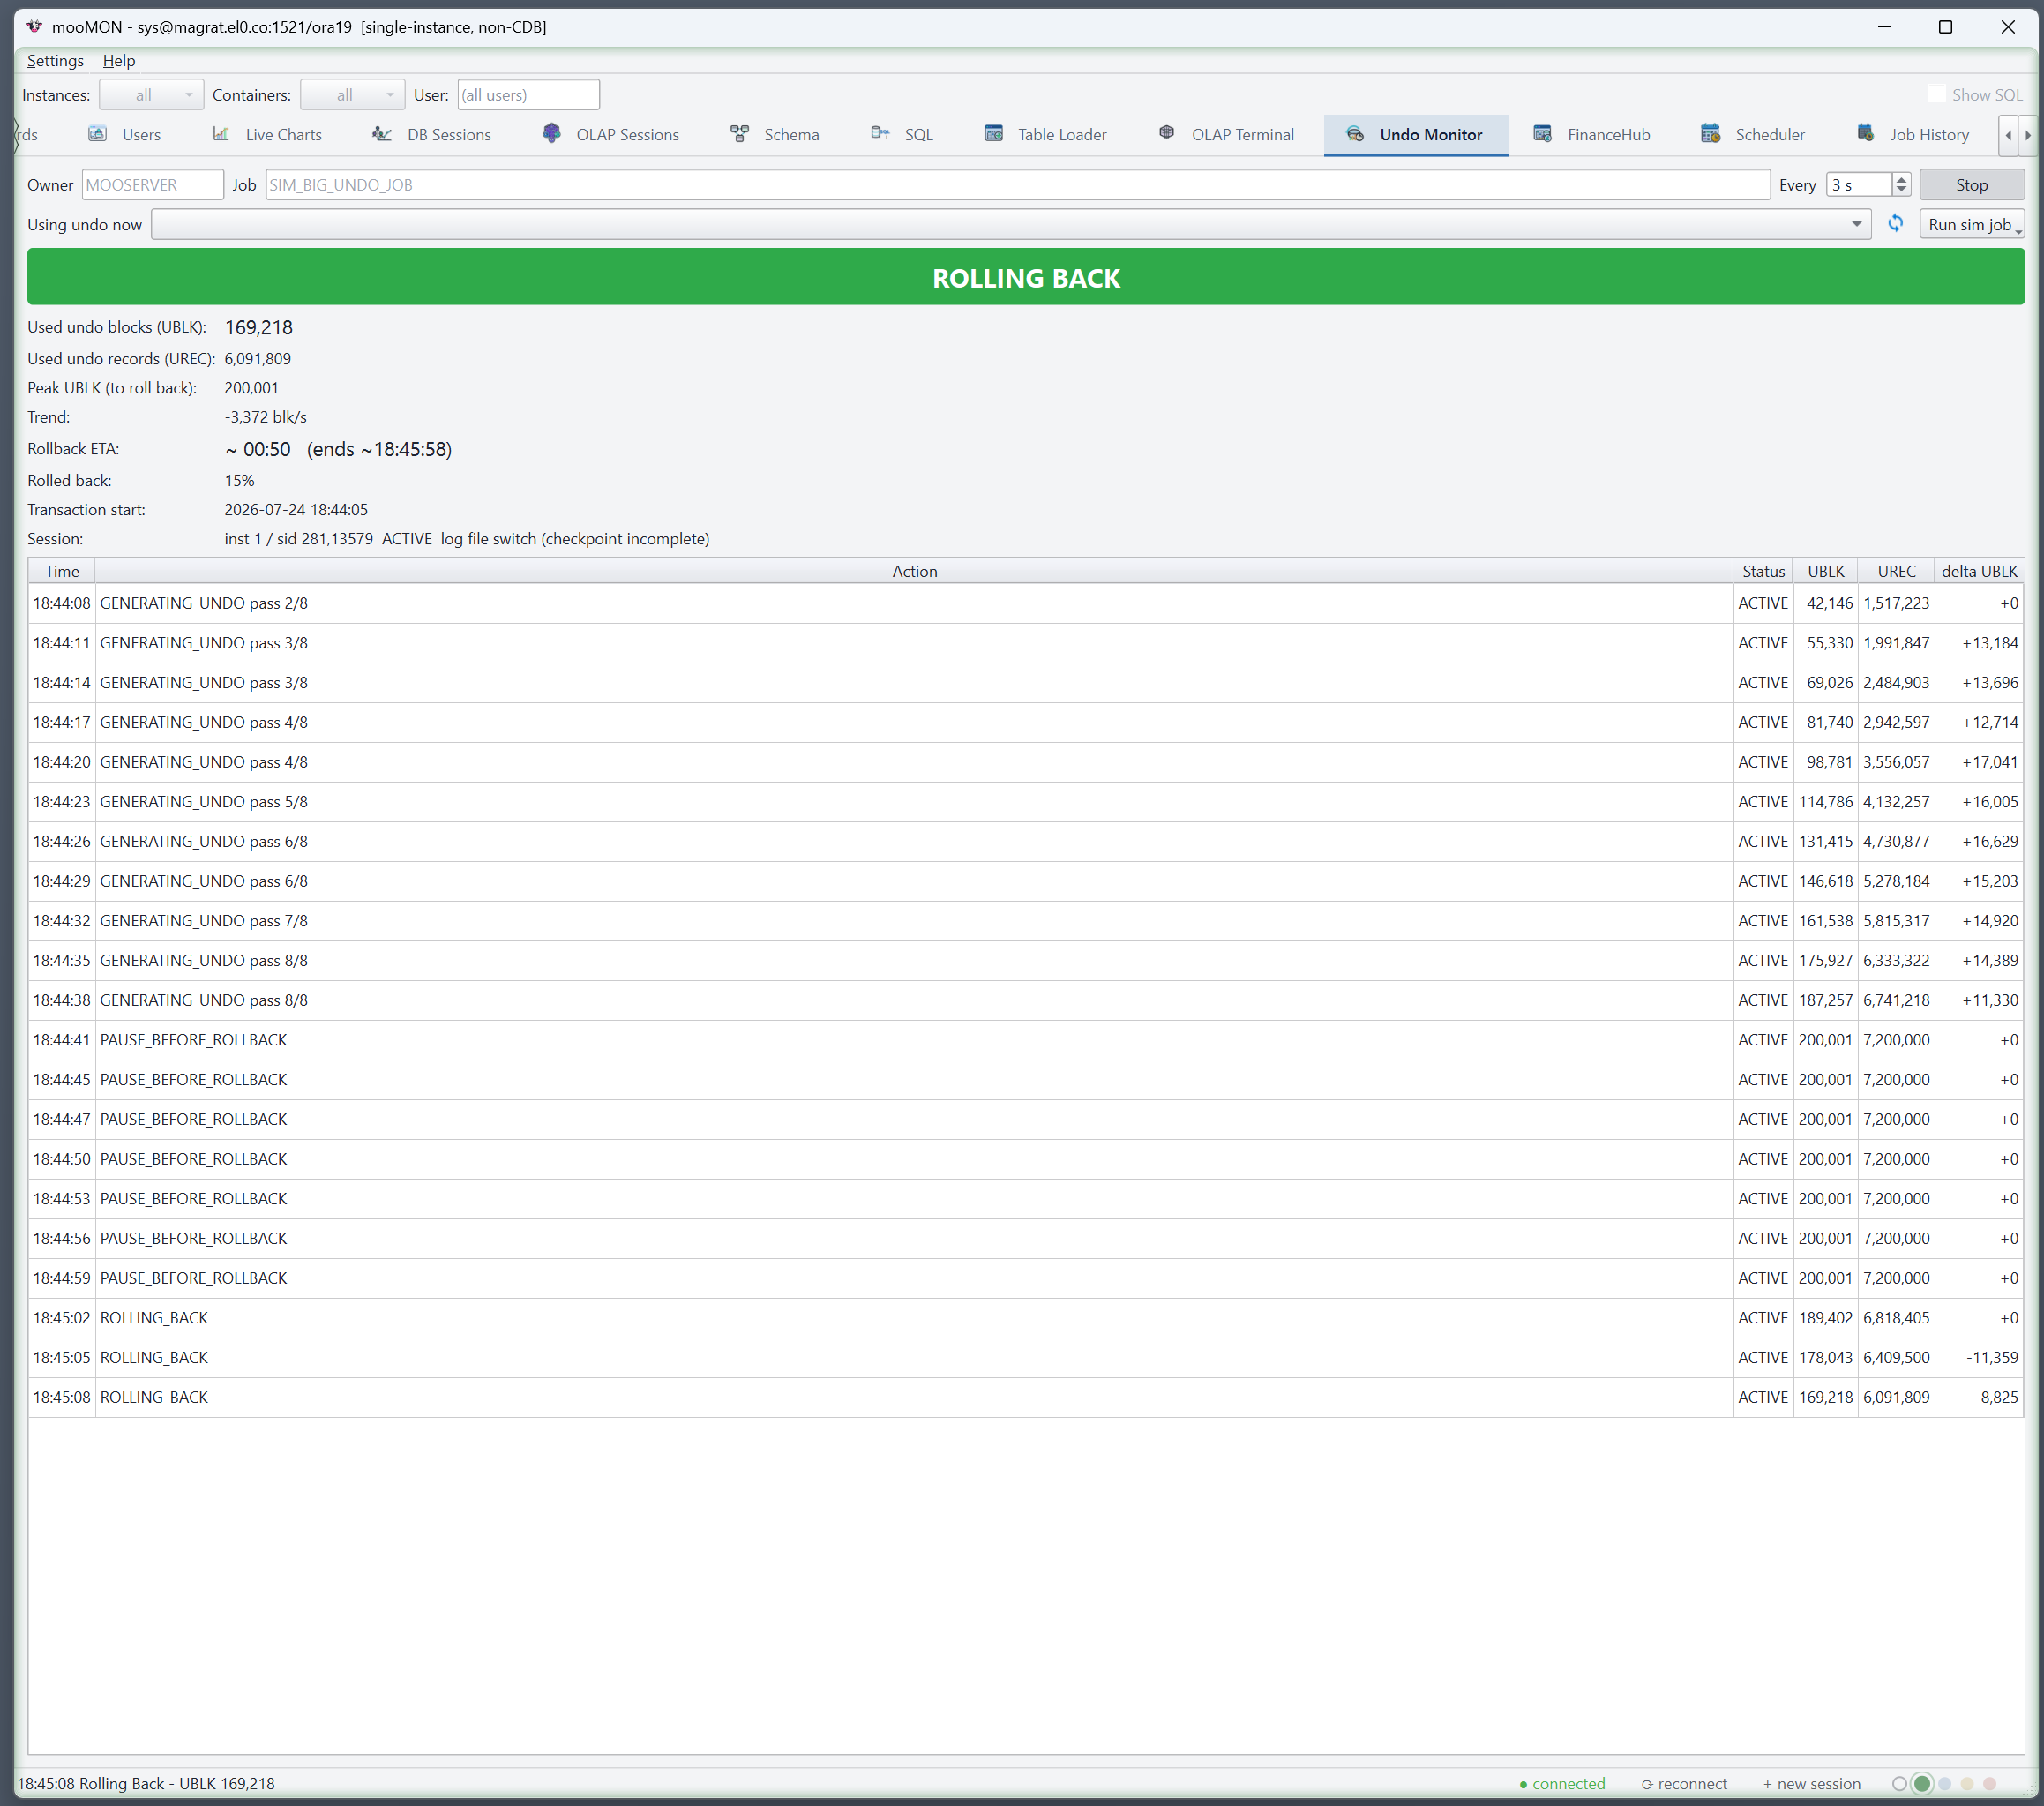
A focused view of undo usage and the sessions consuming it — useful when undo pressure or long-running transactions are in play.
RAC & multitenant
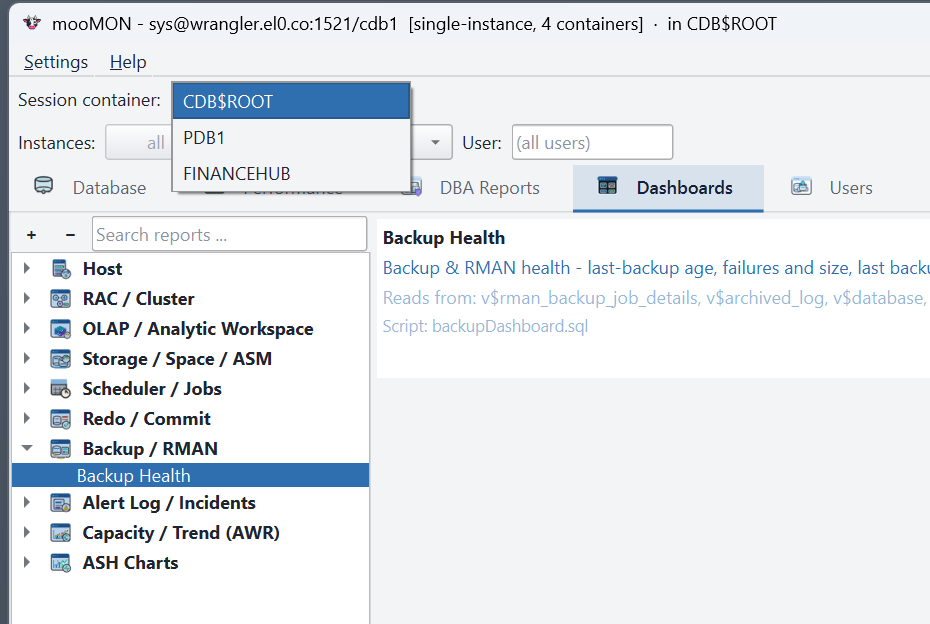
mooMON is cluster- and container-aware throughout. The filter bar scopes monitoring to particular RAC instances or containers; the Instance Viewer lets you pick a single node or watch one line per node; and, from a CDB root, the container switcher in the top bar lets you act inside a PDB — the schema browser, SQL, Table Loader and OLAP all follow the container you choose, so a grant or a load lands where you intend rather than in the root.
The 15 dashboards
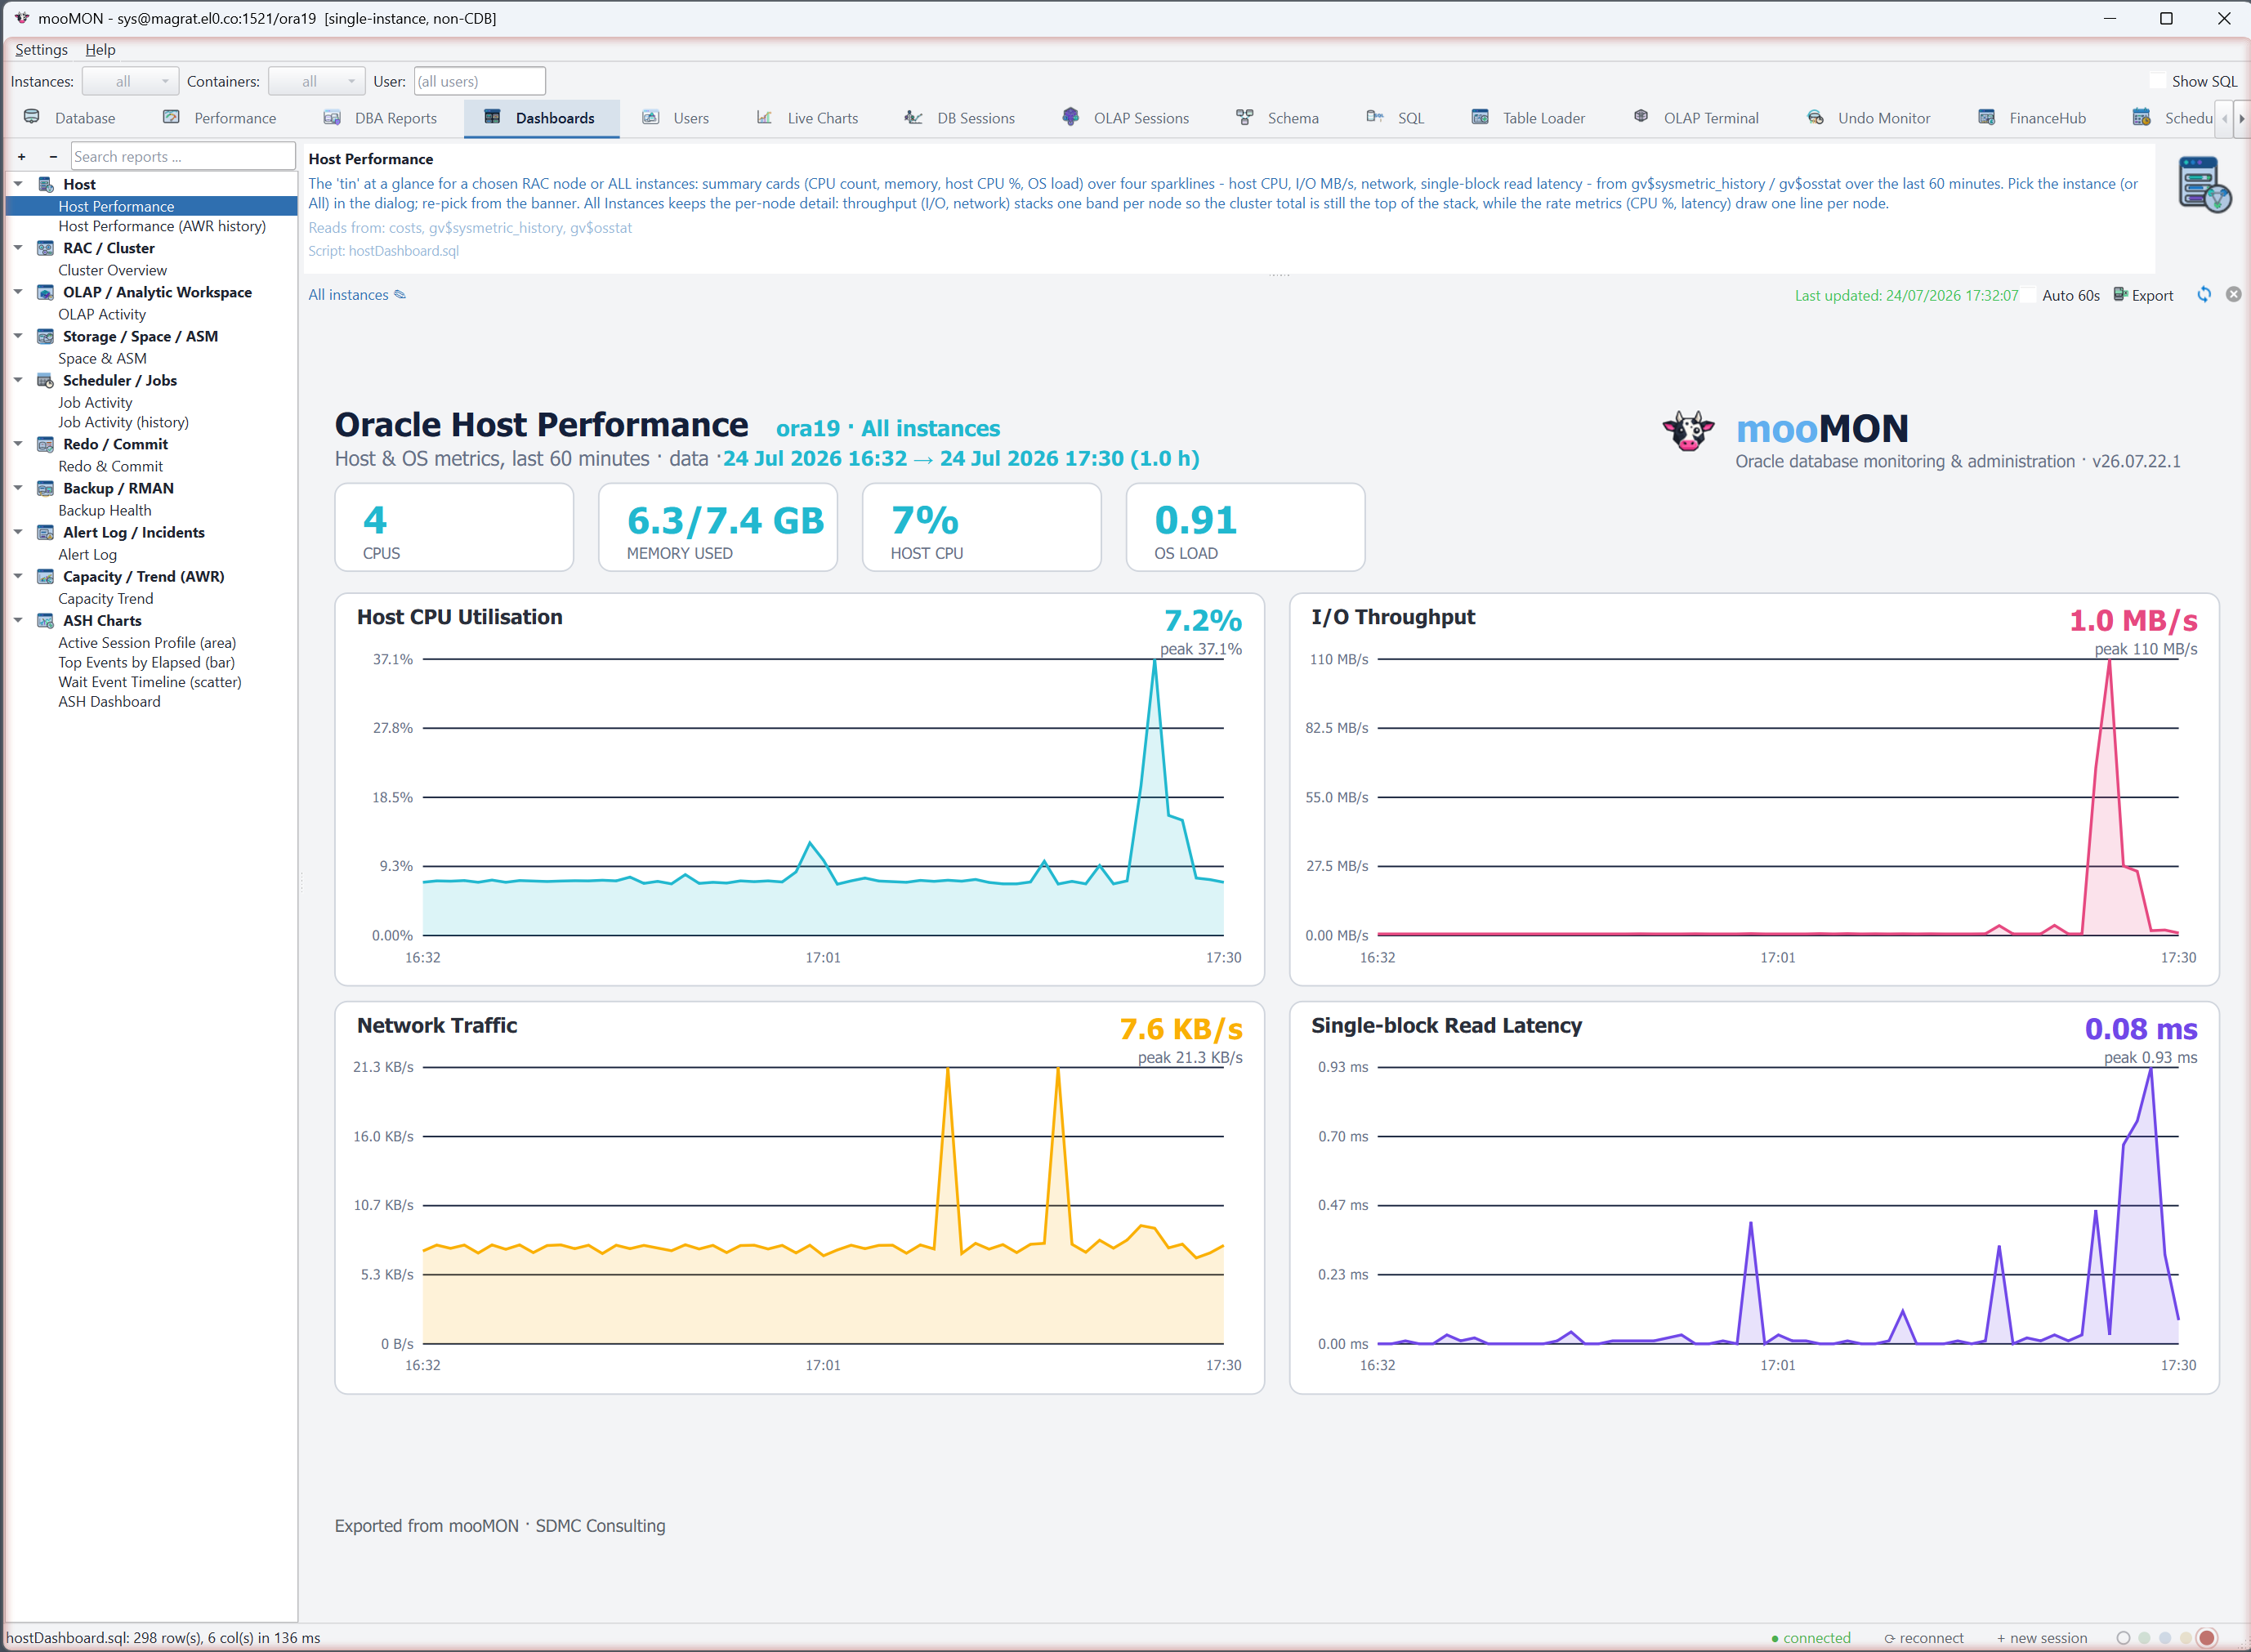
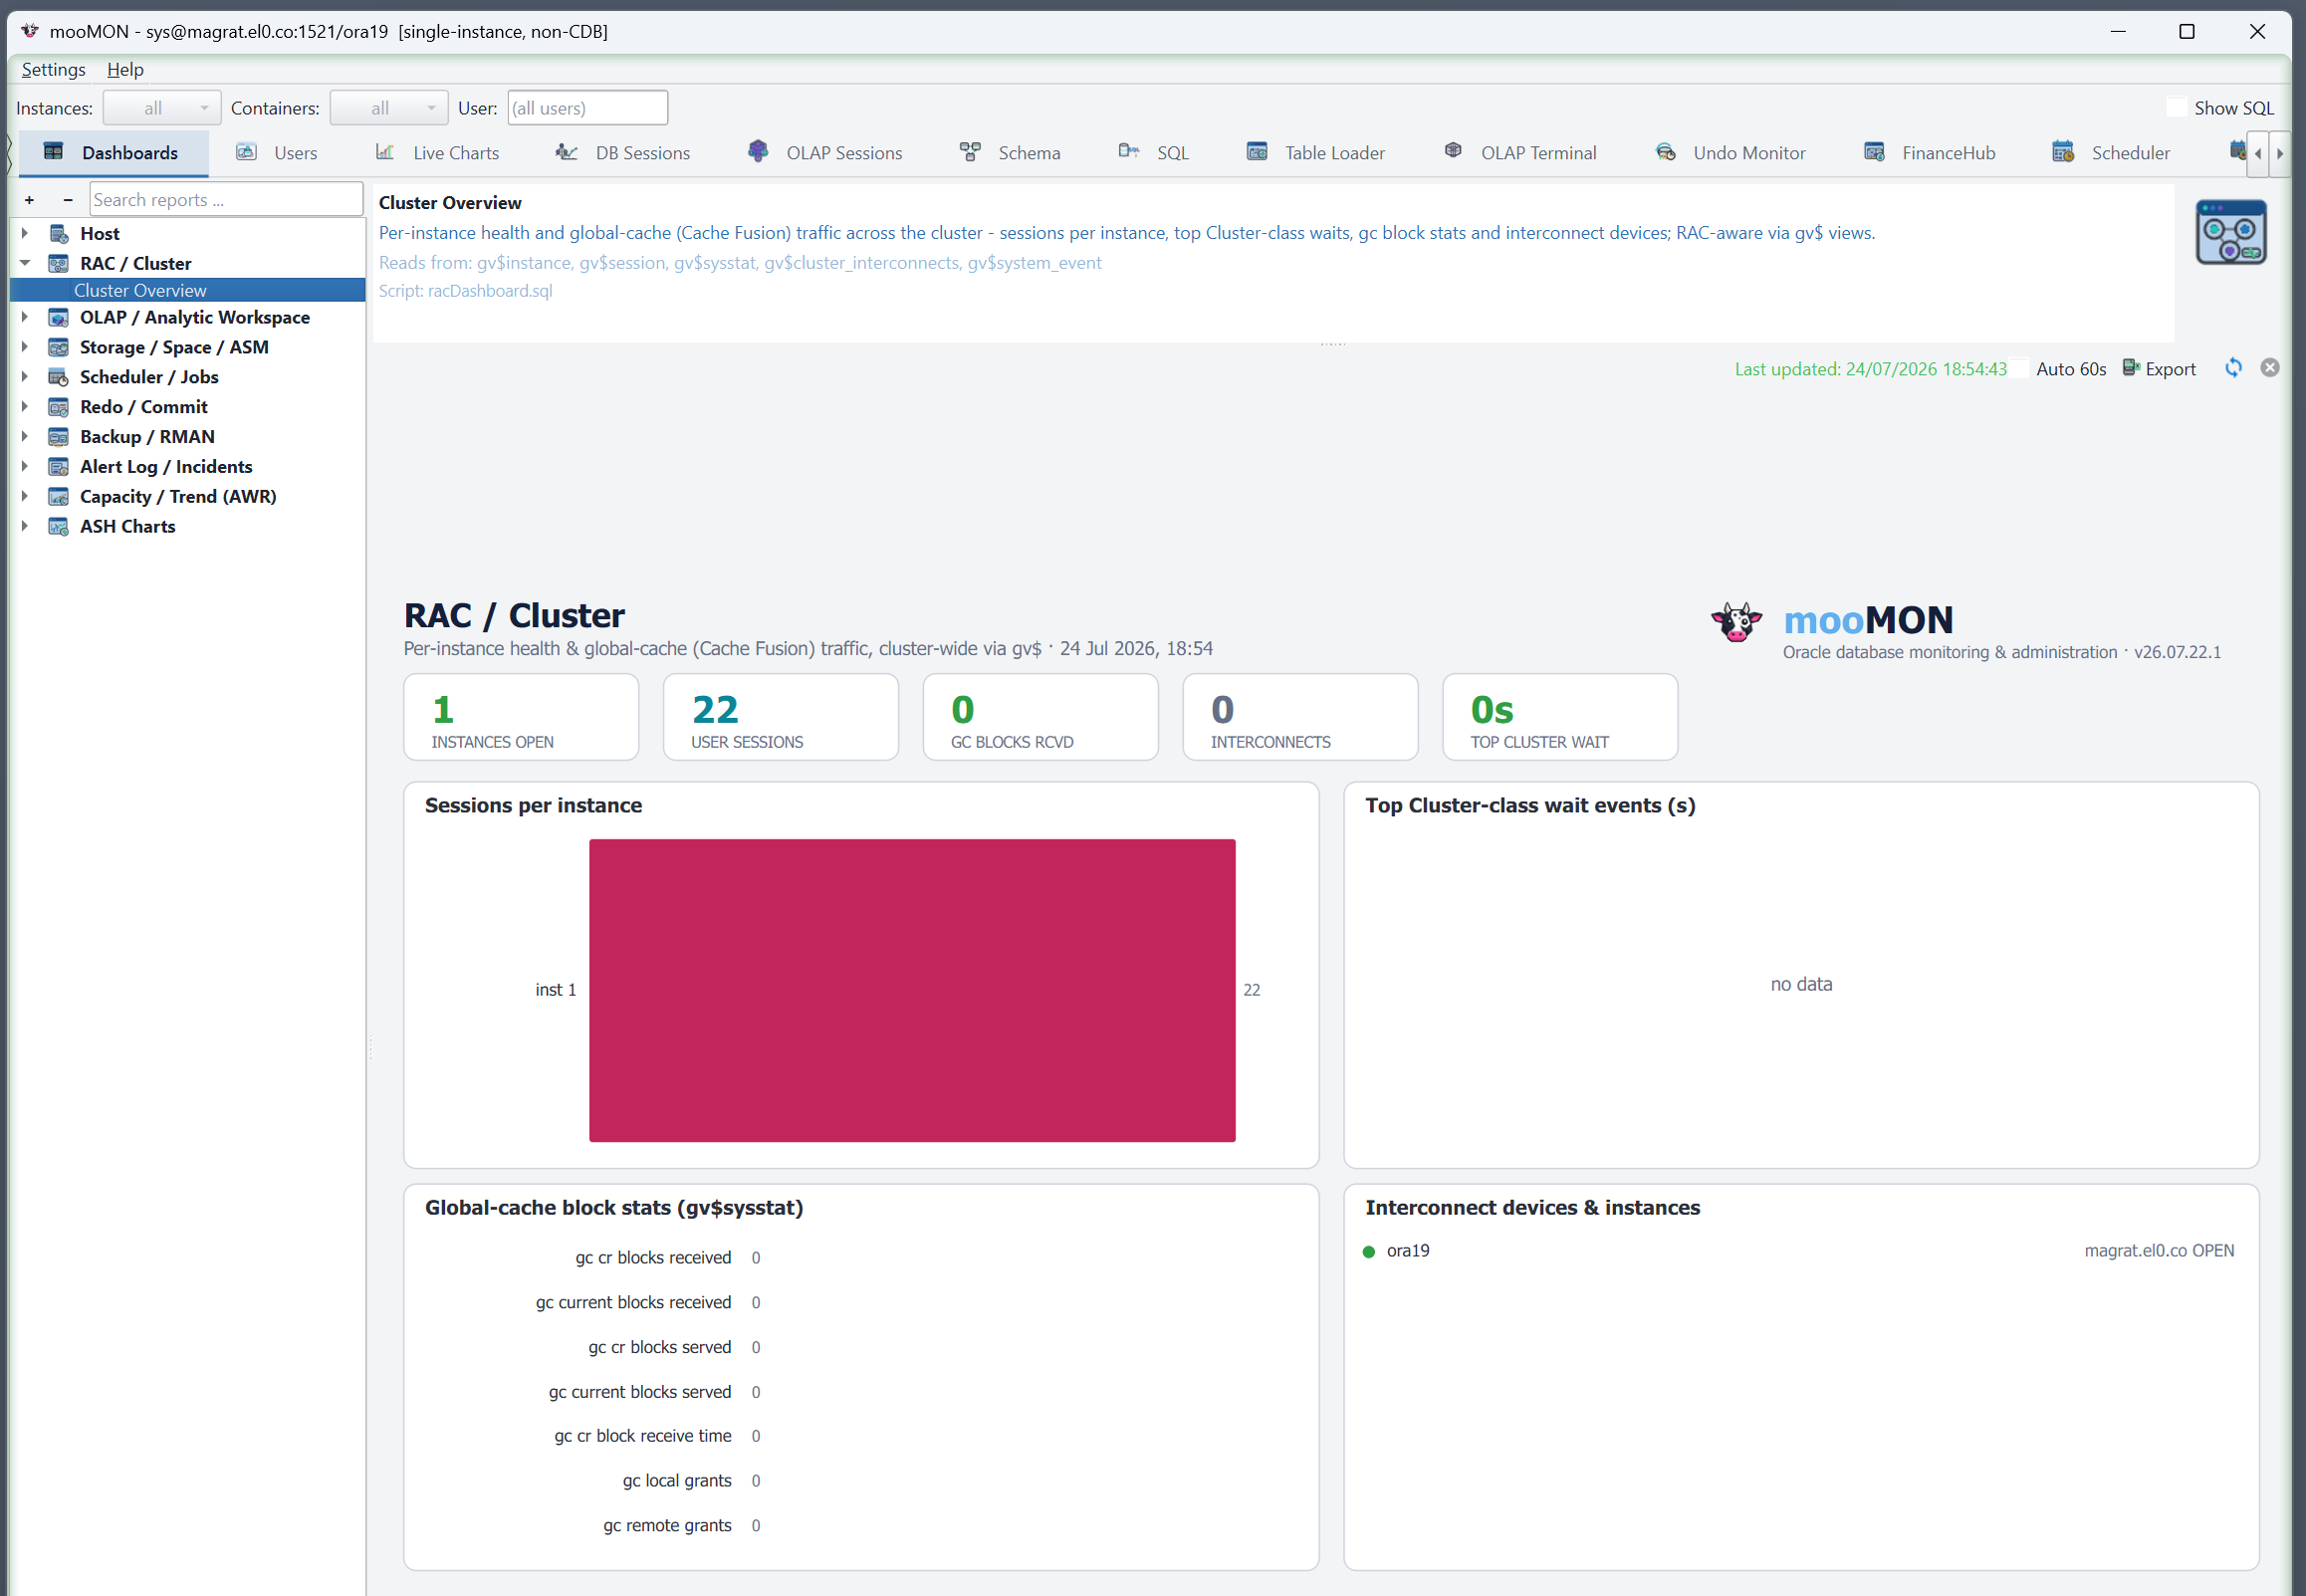
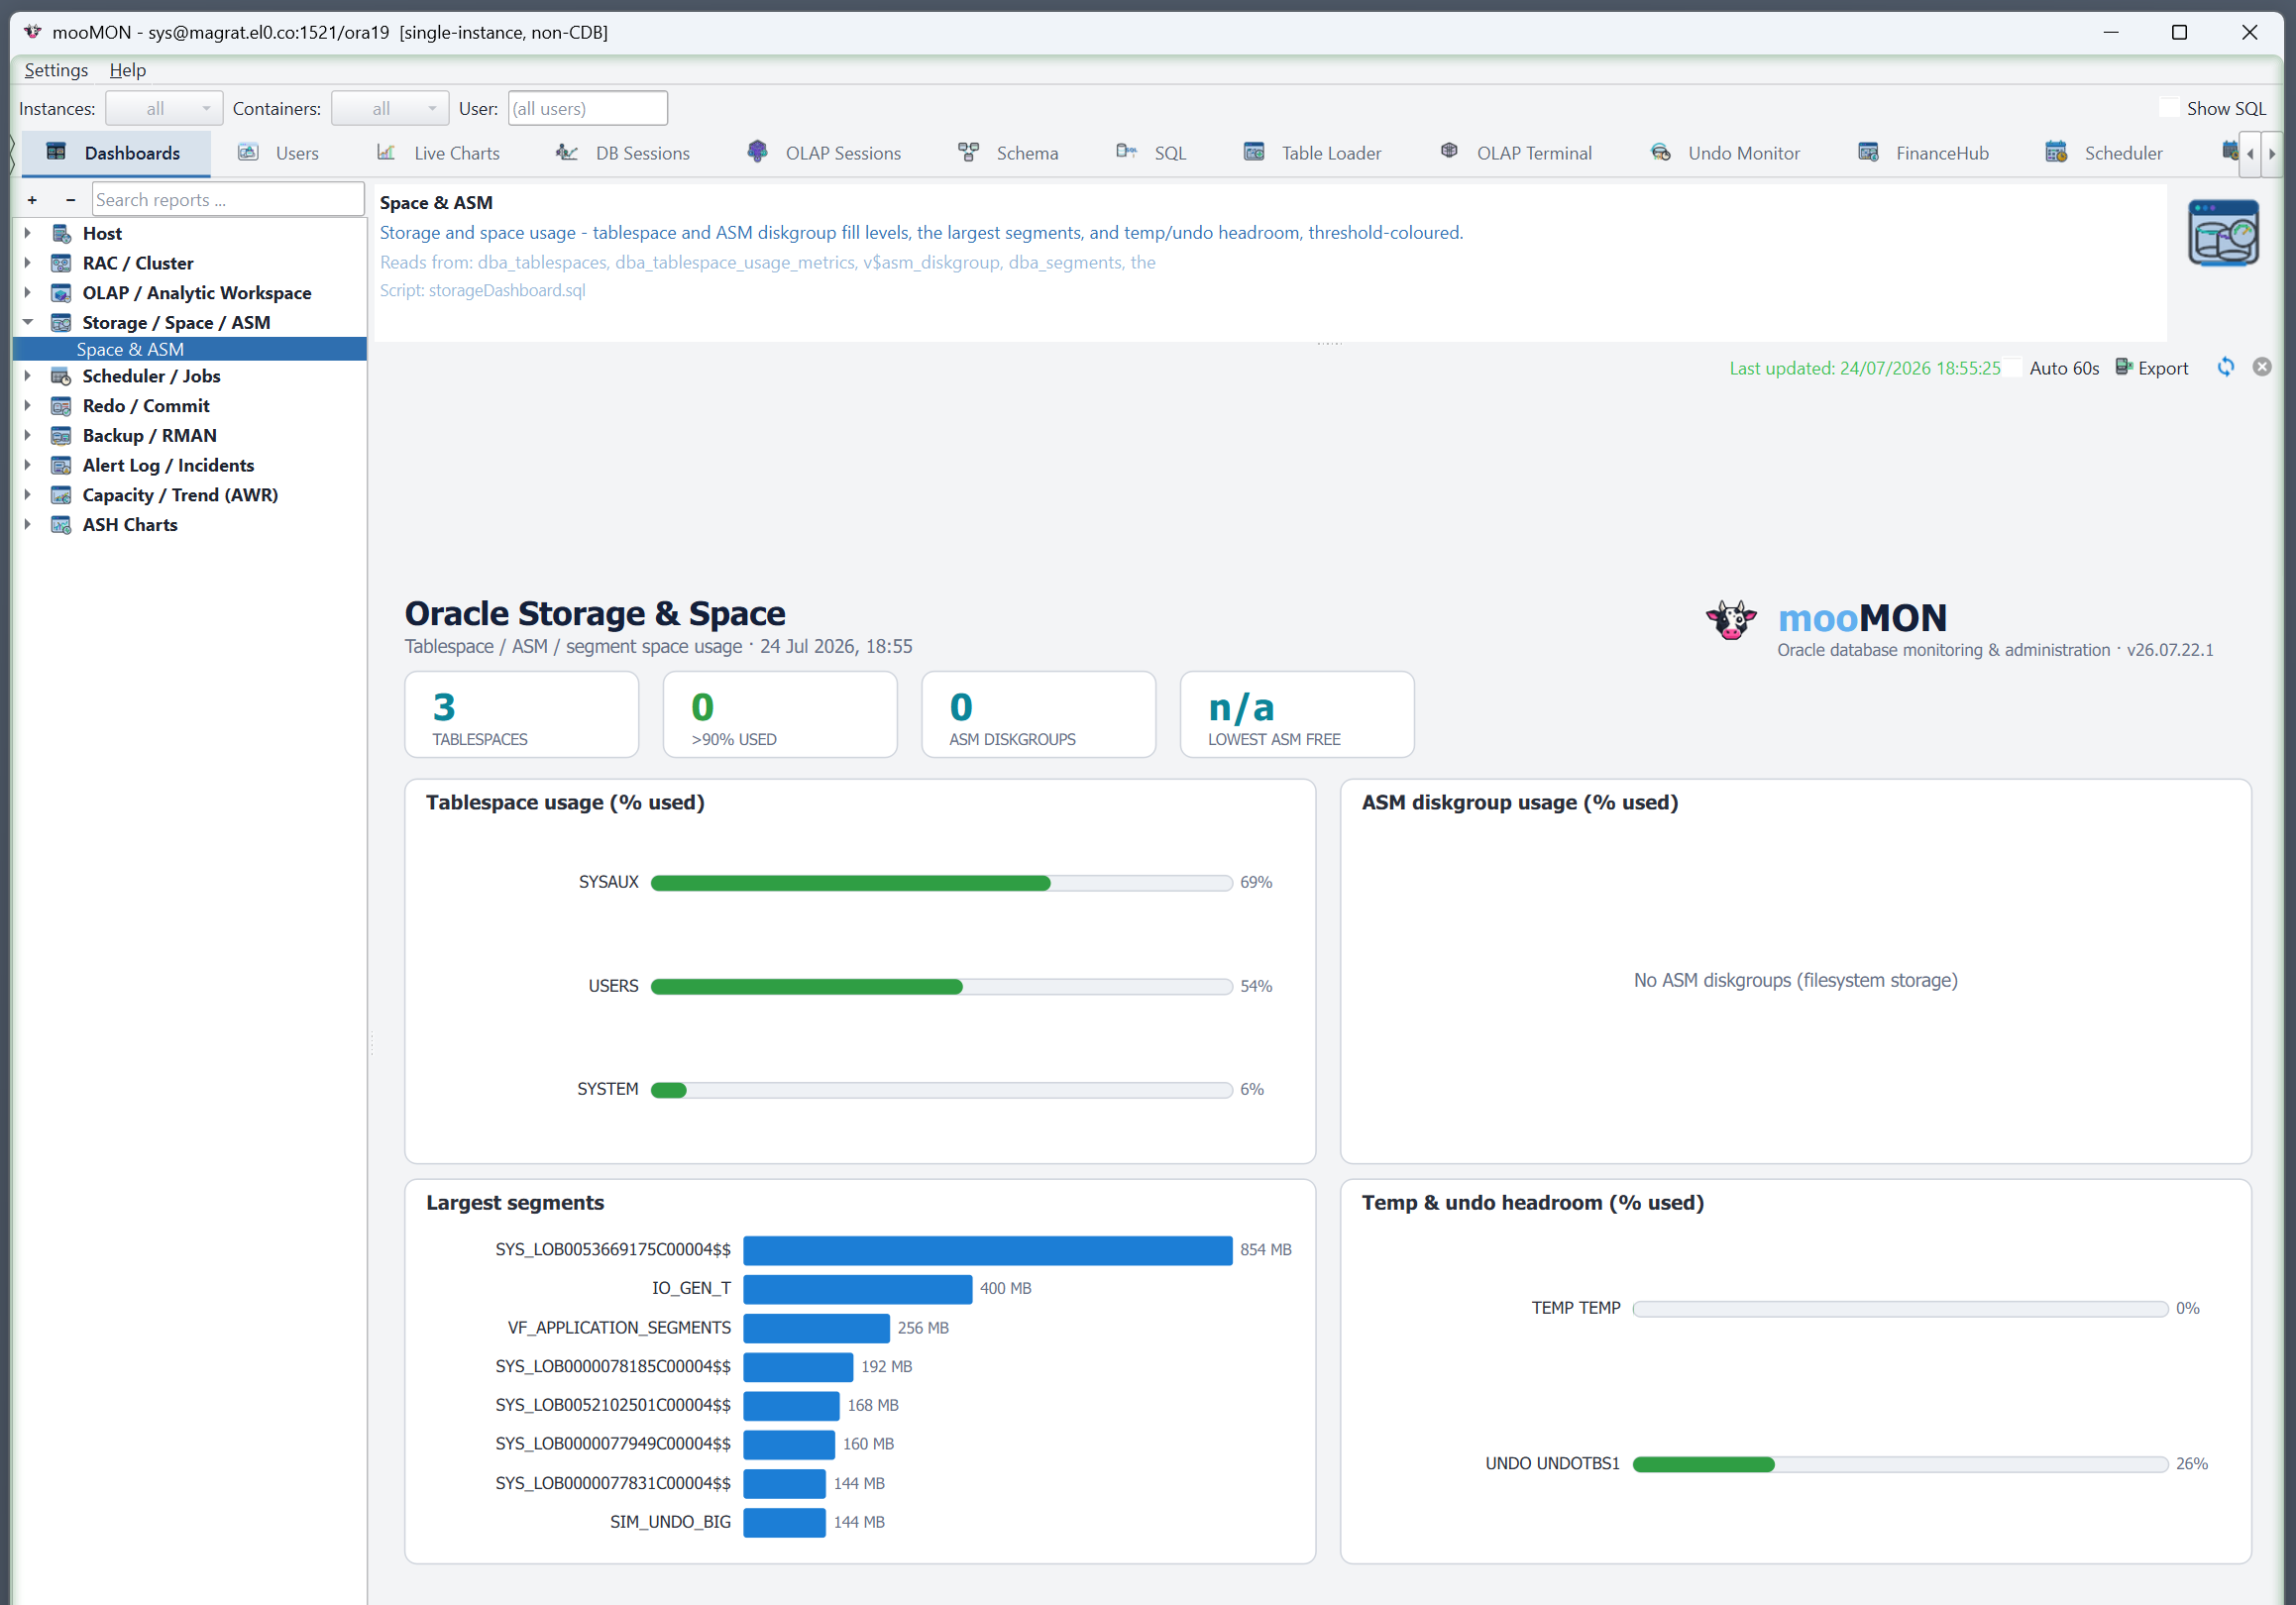
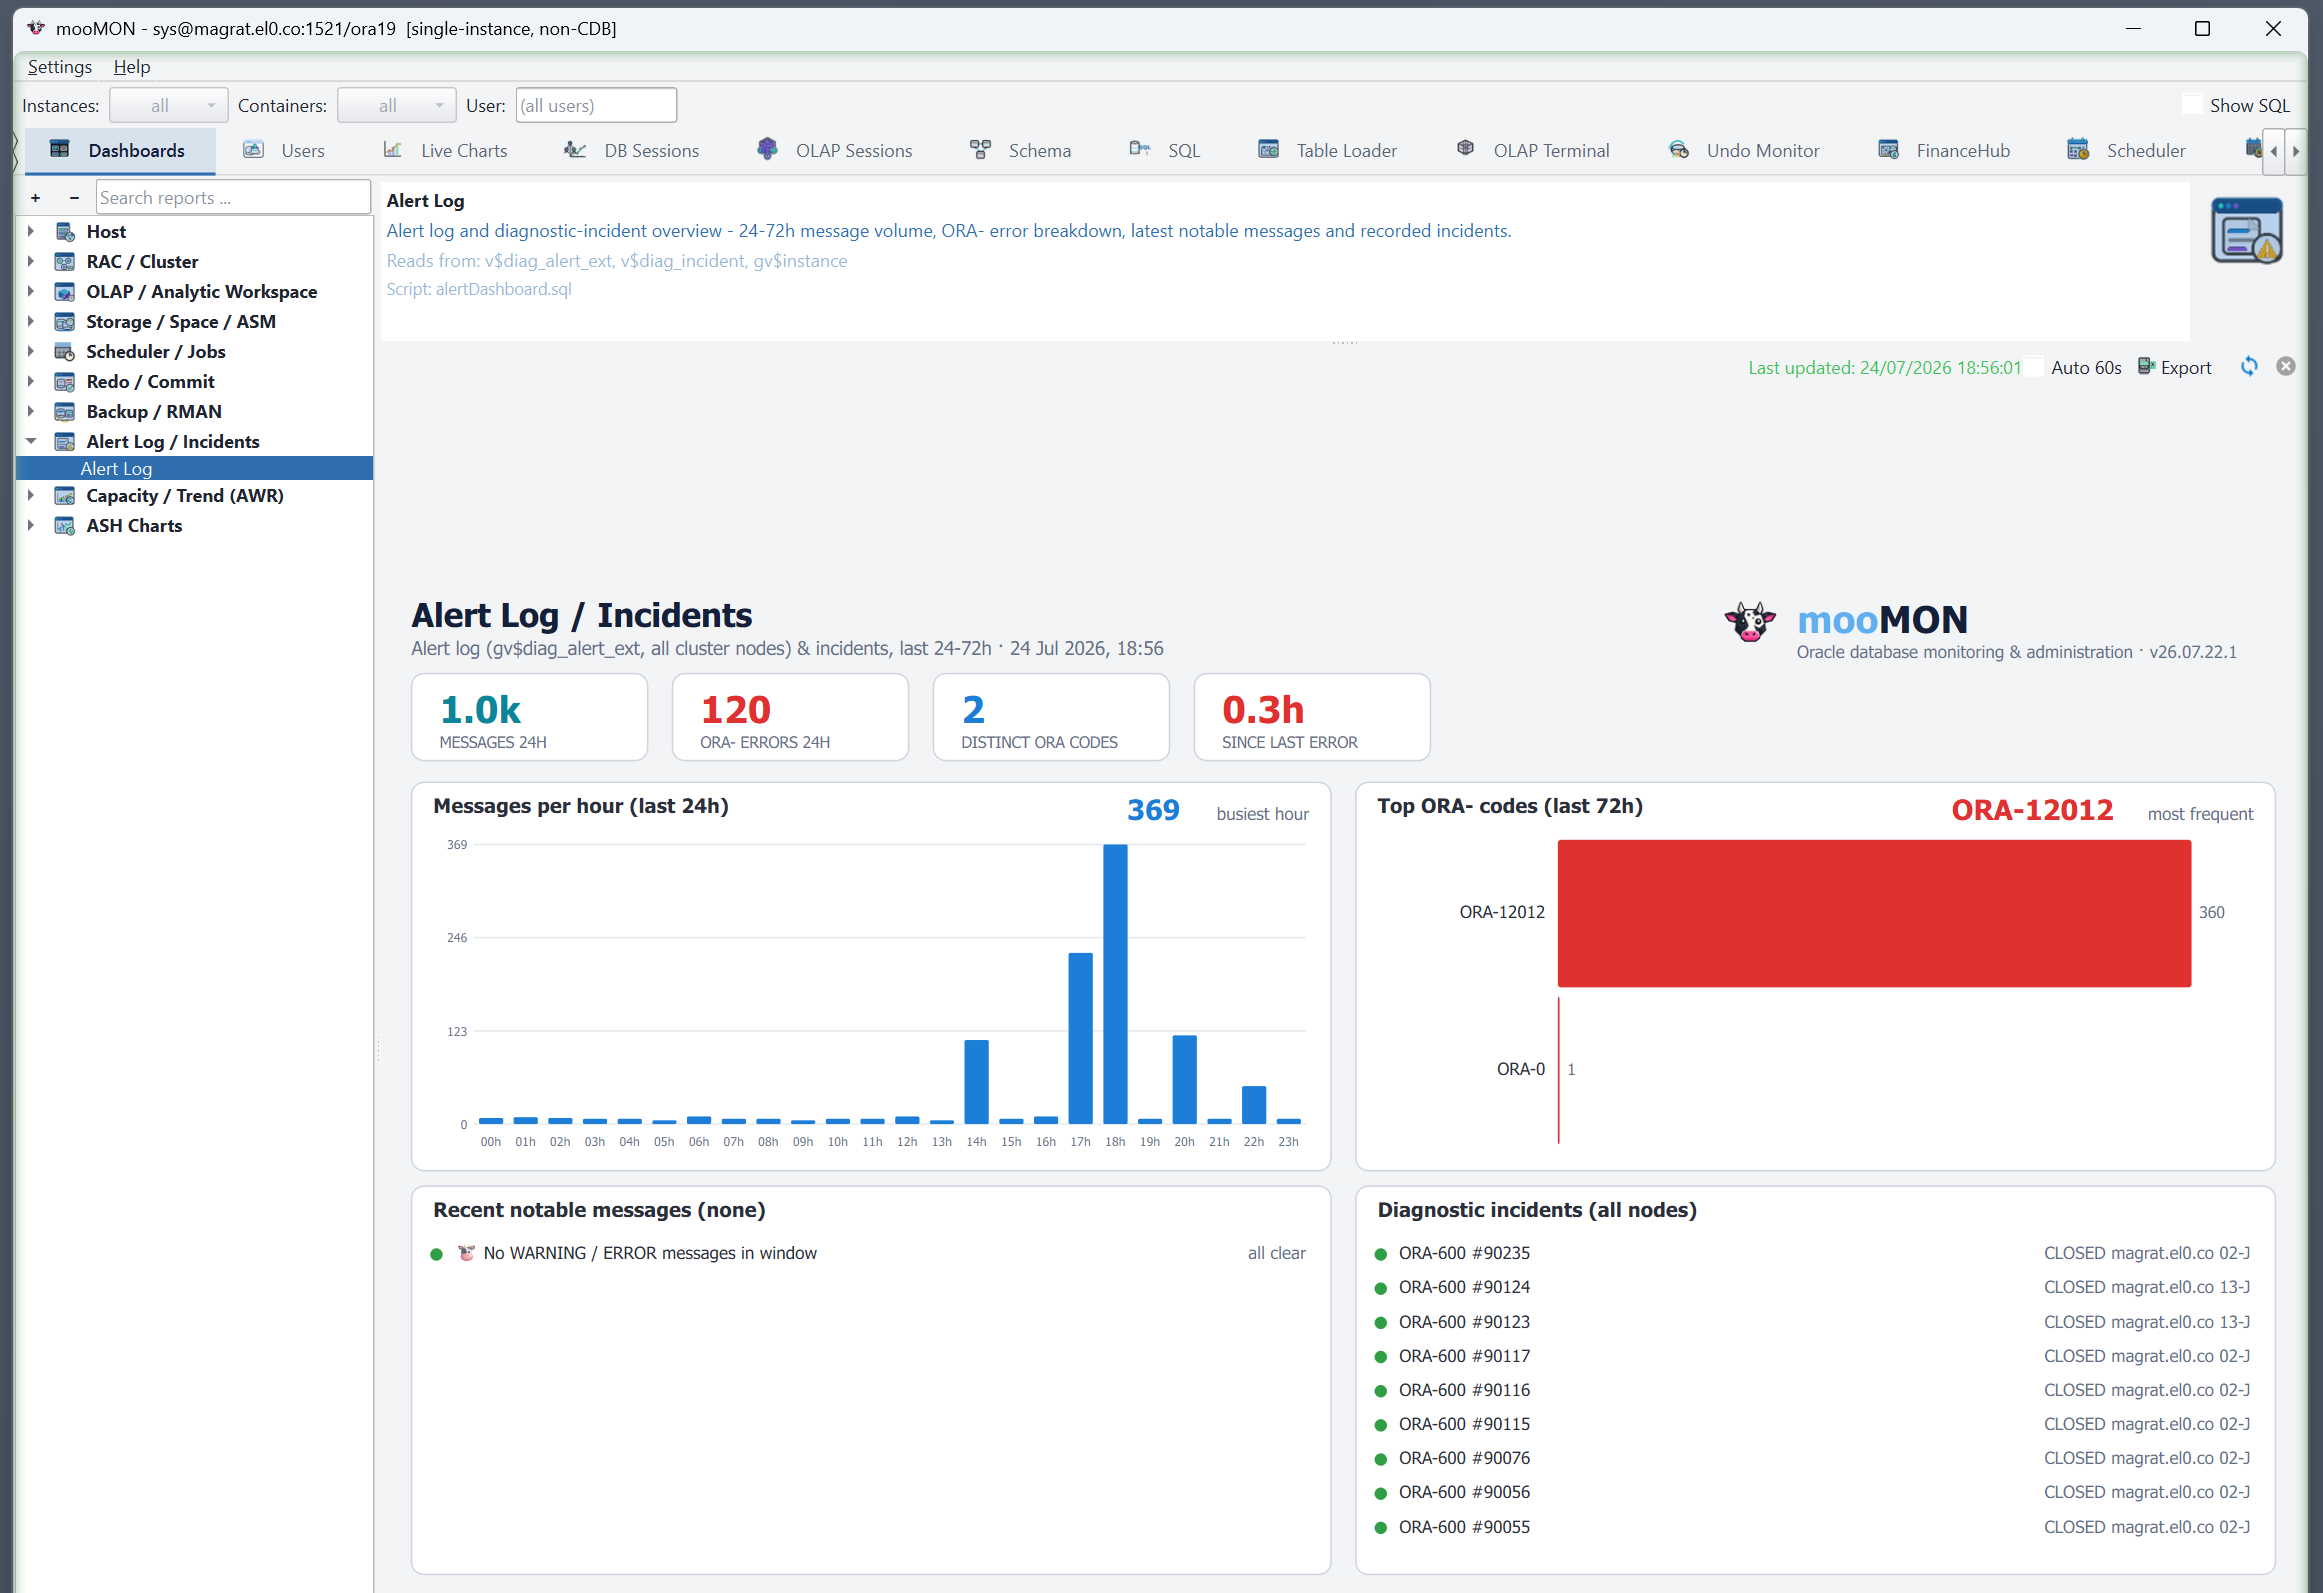
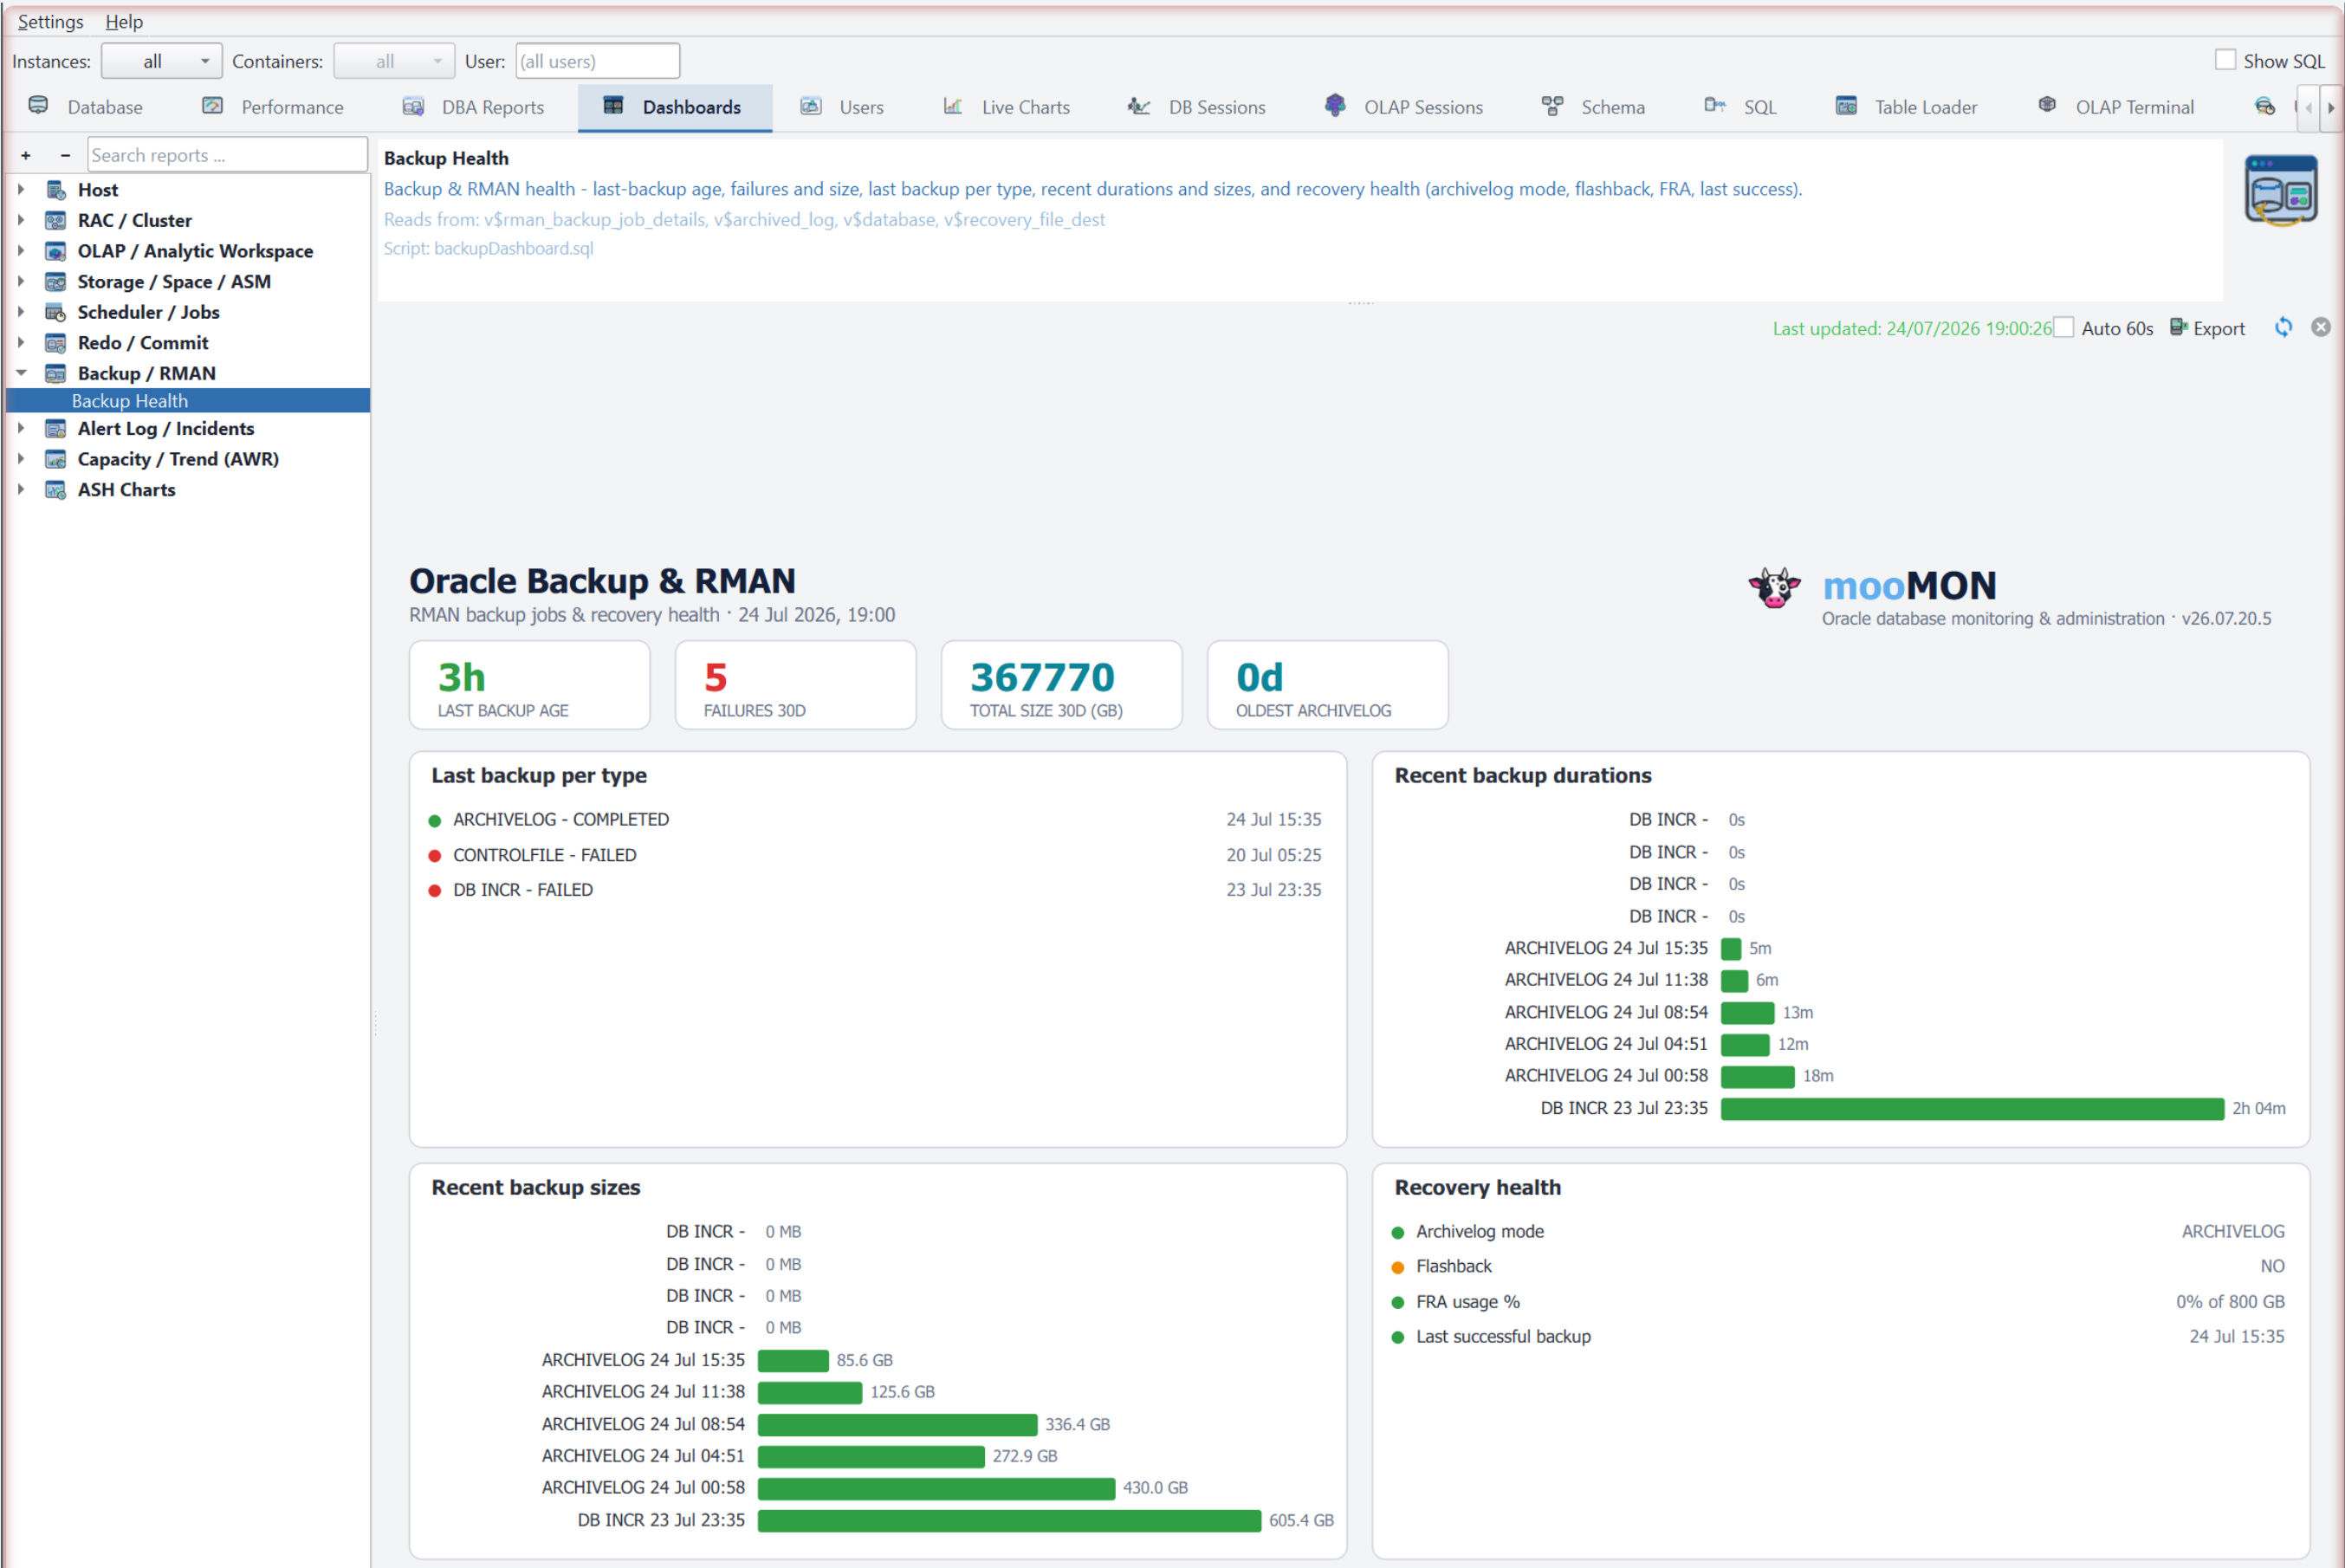
The Dashboards tab collects at-a-glance views built as clean, themed graphics: Host performance (live and from AWR history), RAC cluster overview, OLAP activity, Space & ASM, Scheduler/Jobs, Redo & Commit, Backup/RMAN health, the Alert Log, Capacity trend, and a set of ASH charts. Pick one from the list to render it.
DBA Reports
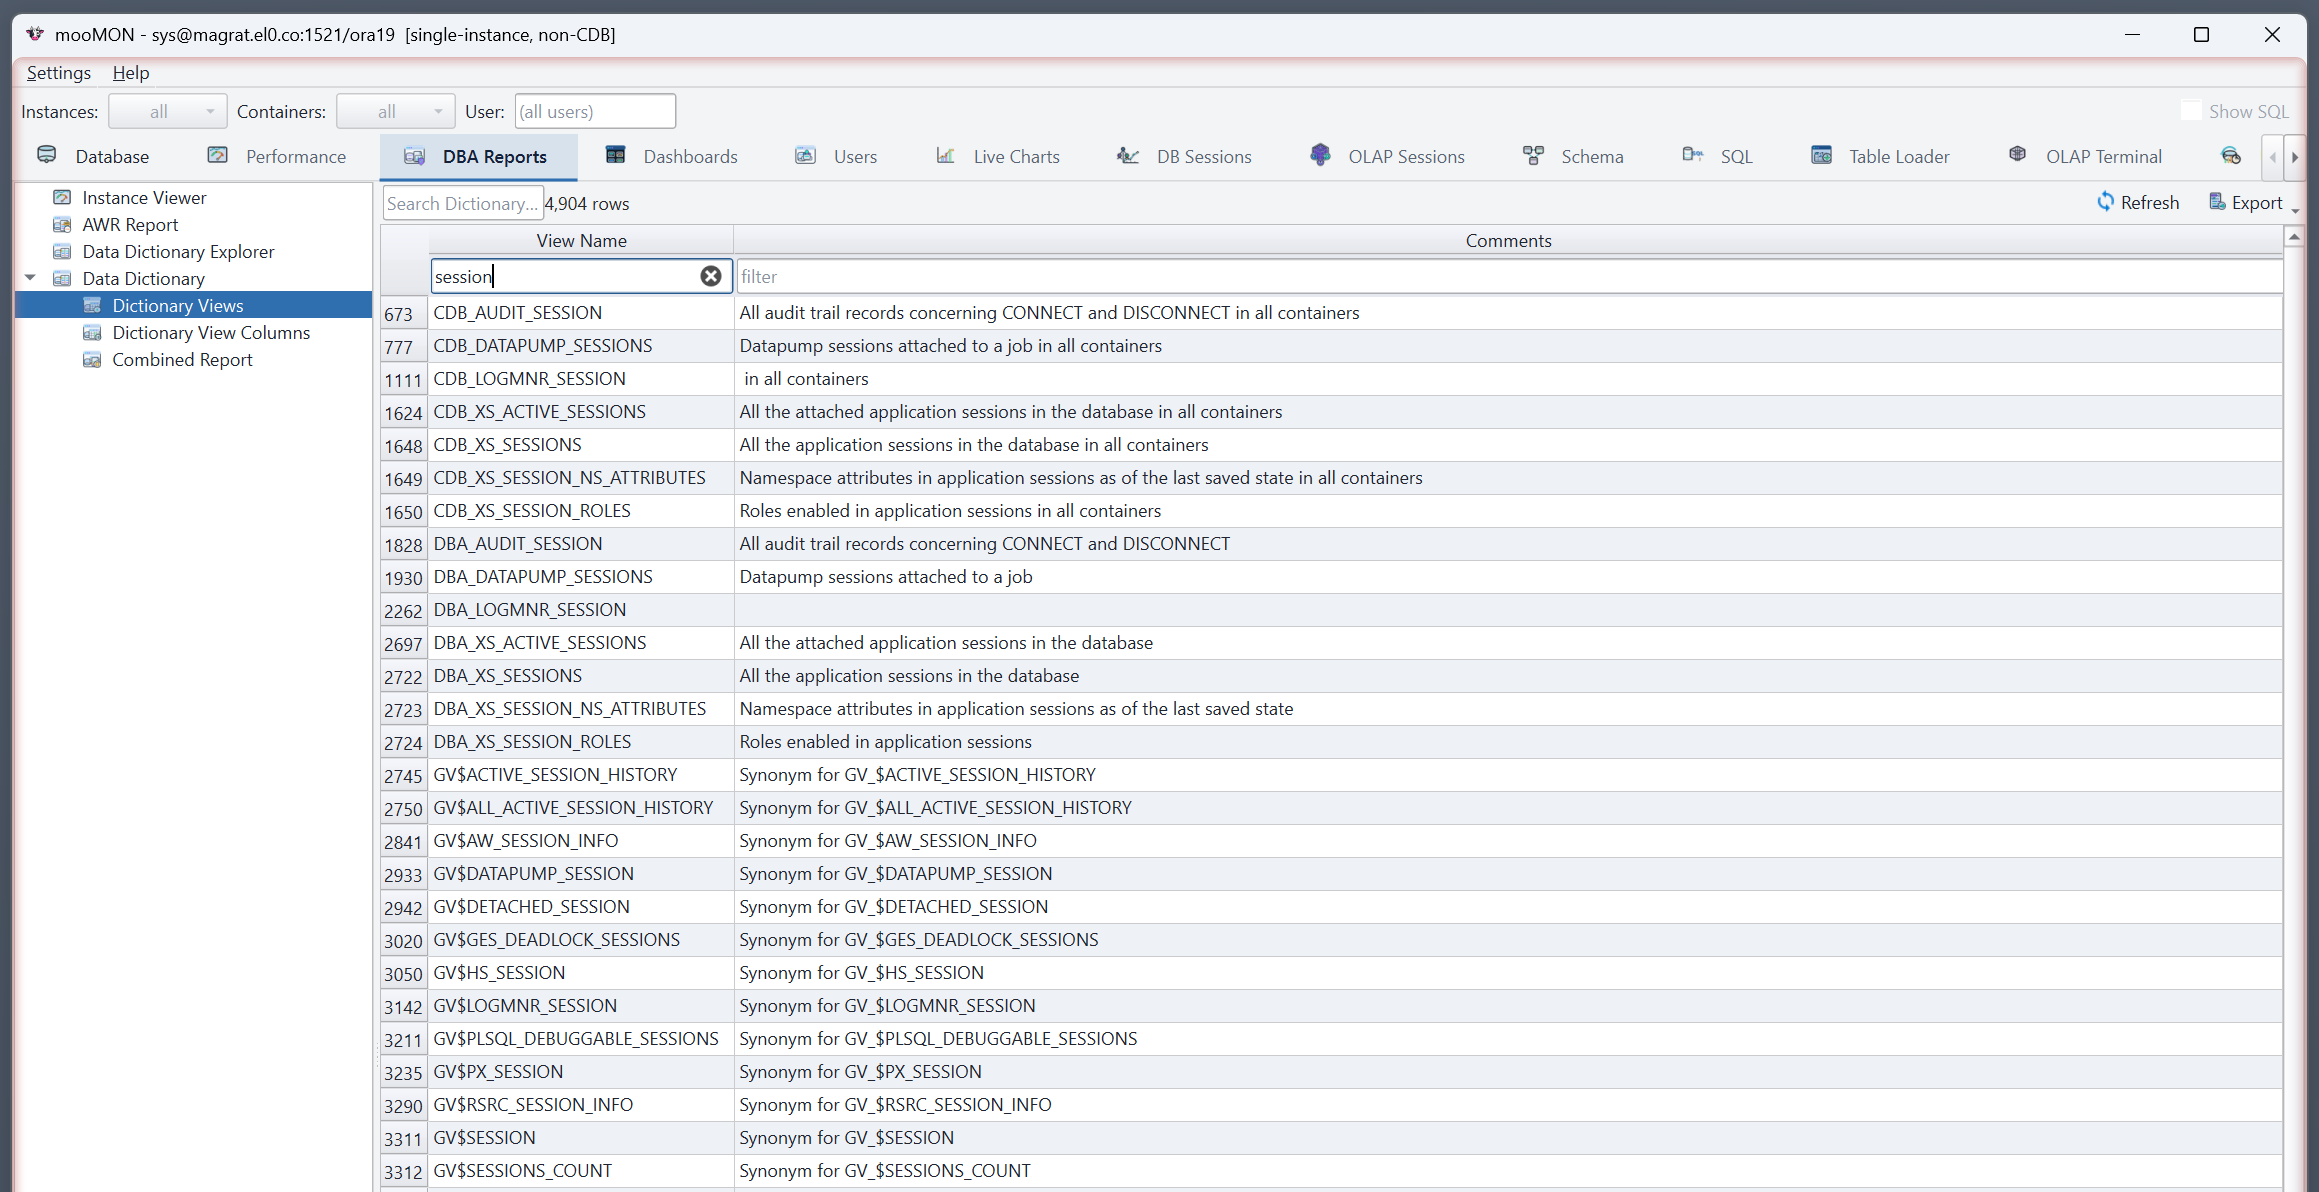
The DBA Reports tab is a hub of DBA tools, kept separate from the day-to-day monitoring reports: the Data Dictionary Explorer and dictionary views, a full AWR report, the Instance Viewer, and combined reports.
The data dictionary
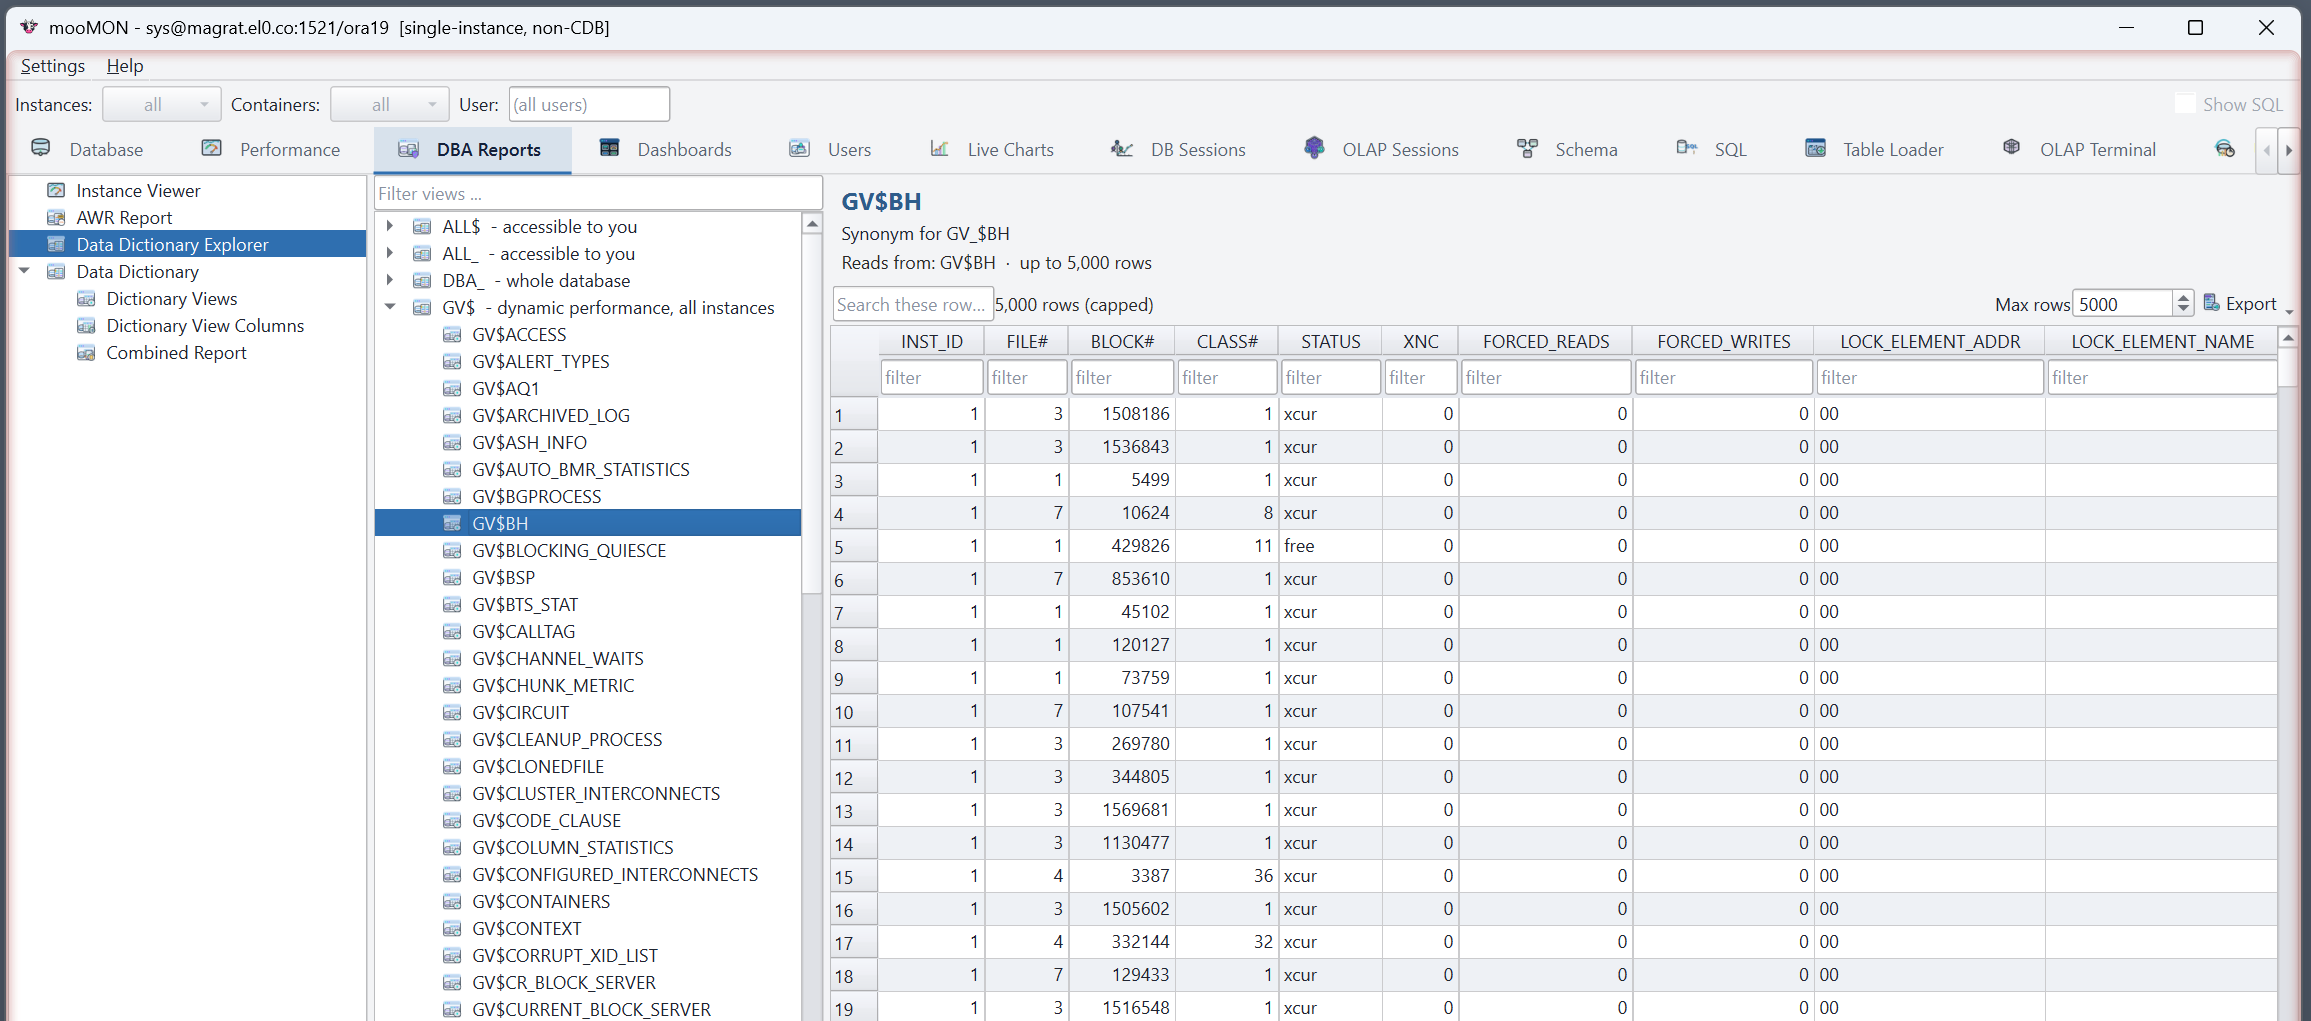
The Data Dictionary Explorer browses Oracle's description of its own catalogue by
subject — a quick way to find the right DBA_* or V$ view and see its
columns and comments without leaving mooMON.
AWR reports
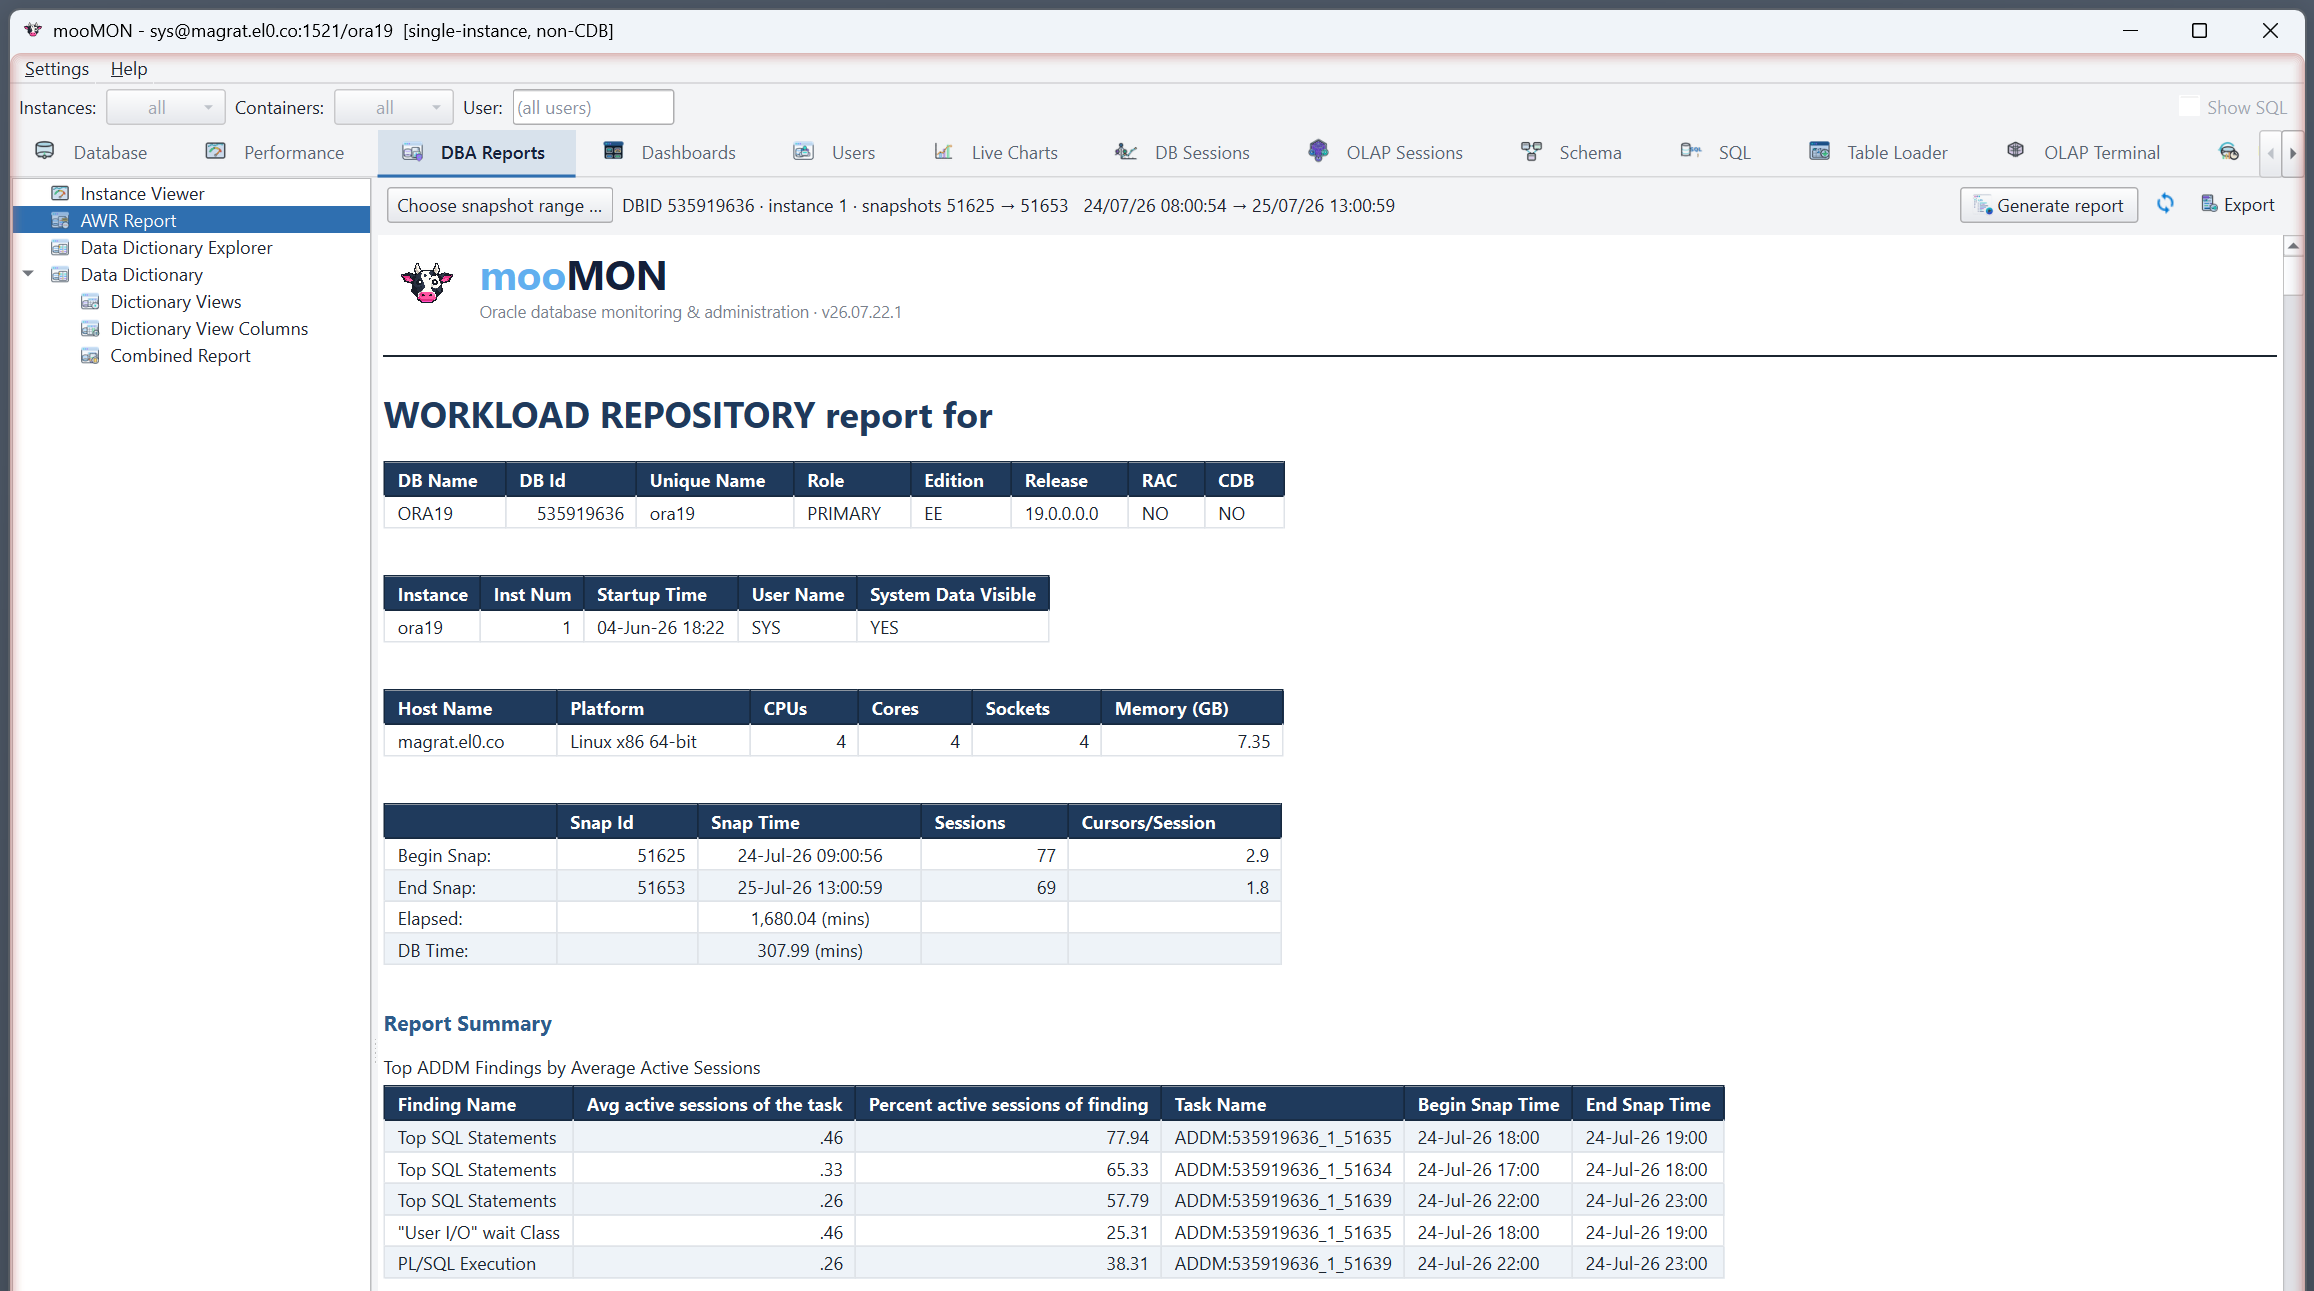
Generate Oracle's full AWR report for a snapshot range and read it inside mooMON, restyled to match. Pick the begin and end snapshots, click Generate report, and the workload repository report renders inline — DB summary, load profile, top timed events, ADDM findings and the rest.
SQL — editor & completion
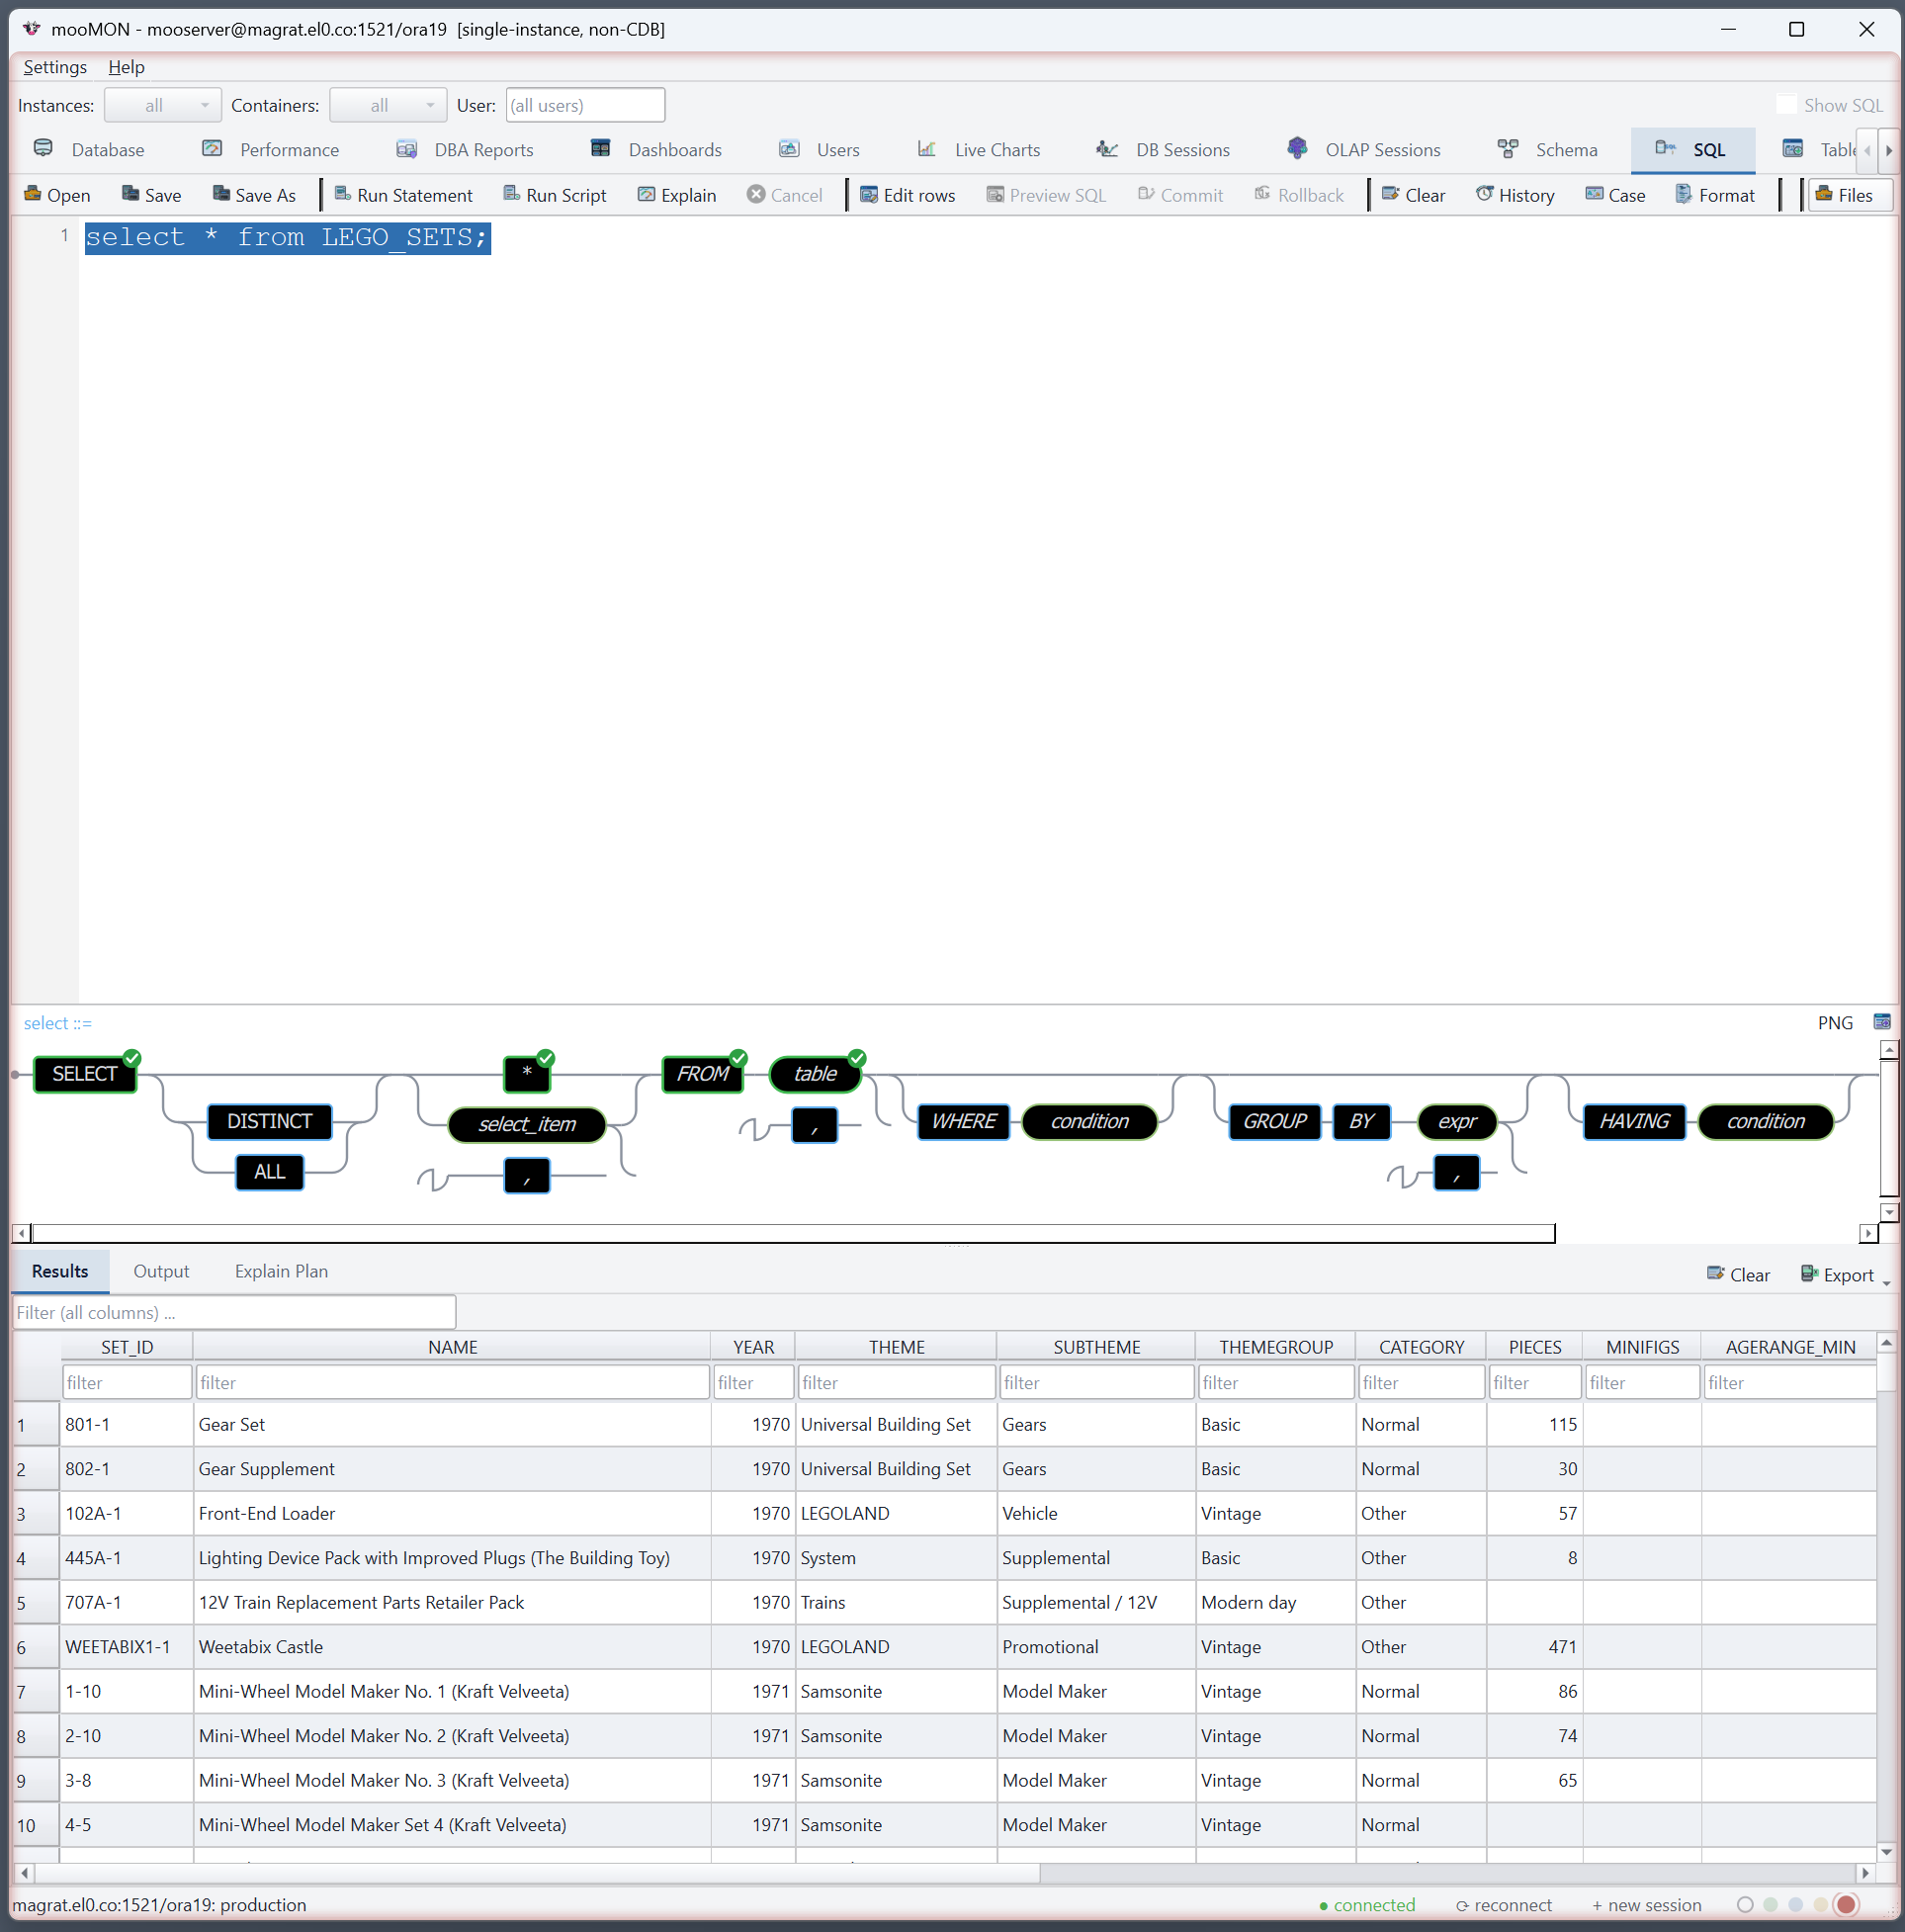
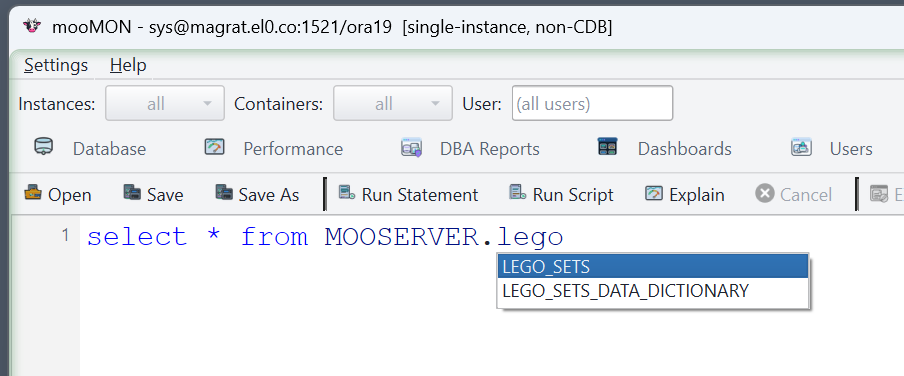
A full SQL workspace with syntax highlighting, formatting, statement history, and column-aware completion that suggests tables and their columns as you type. Run a single statement or a whole script; results appear in the grid below, ready to filter and export.
Explain & the syntax diagram
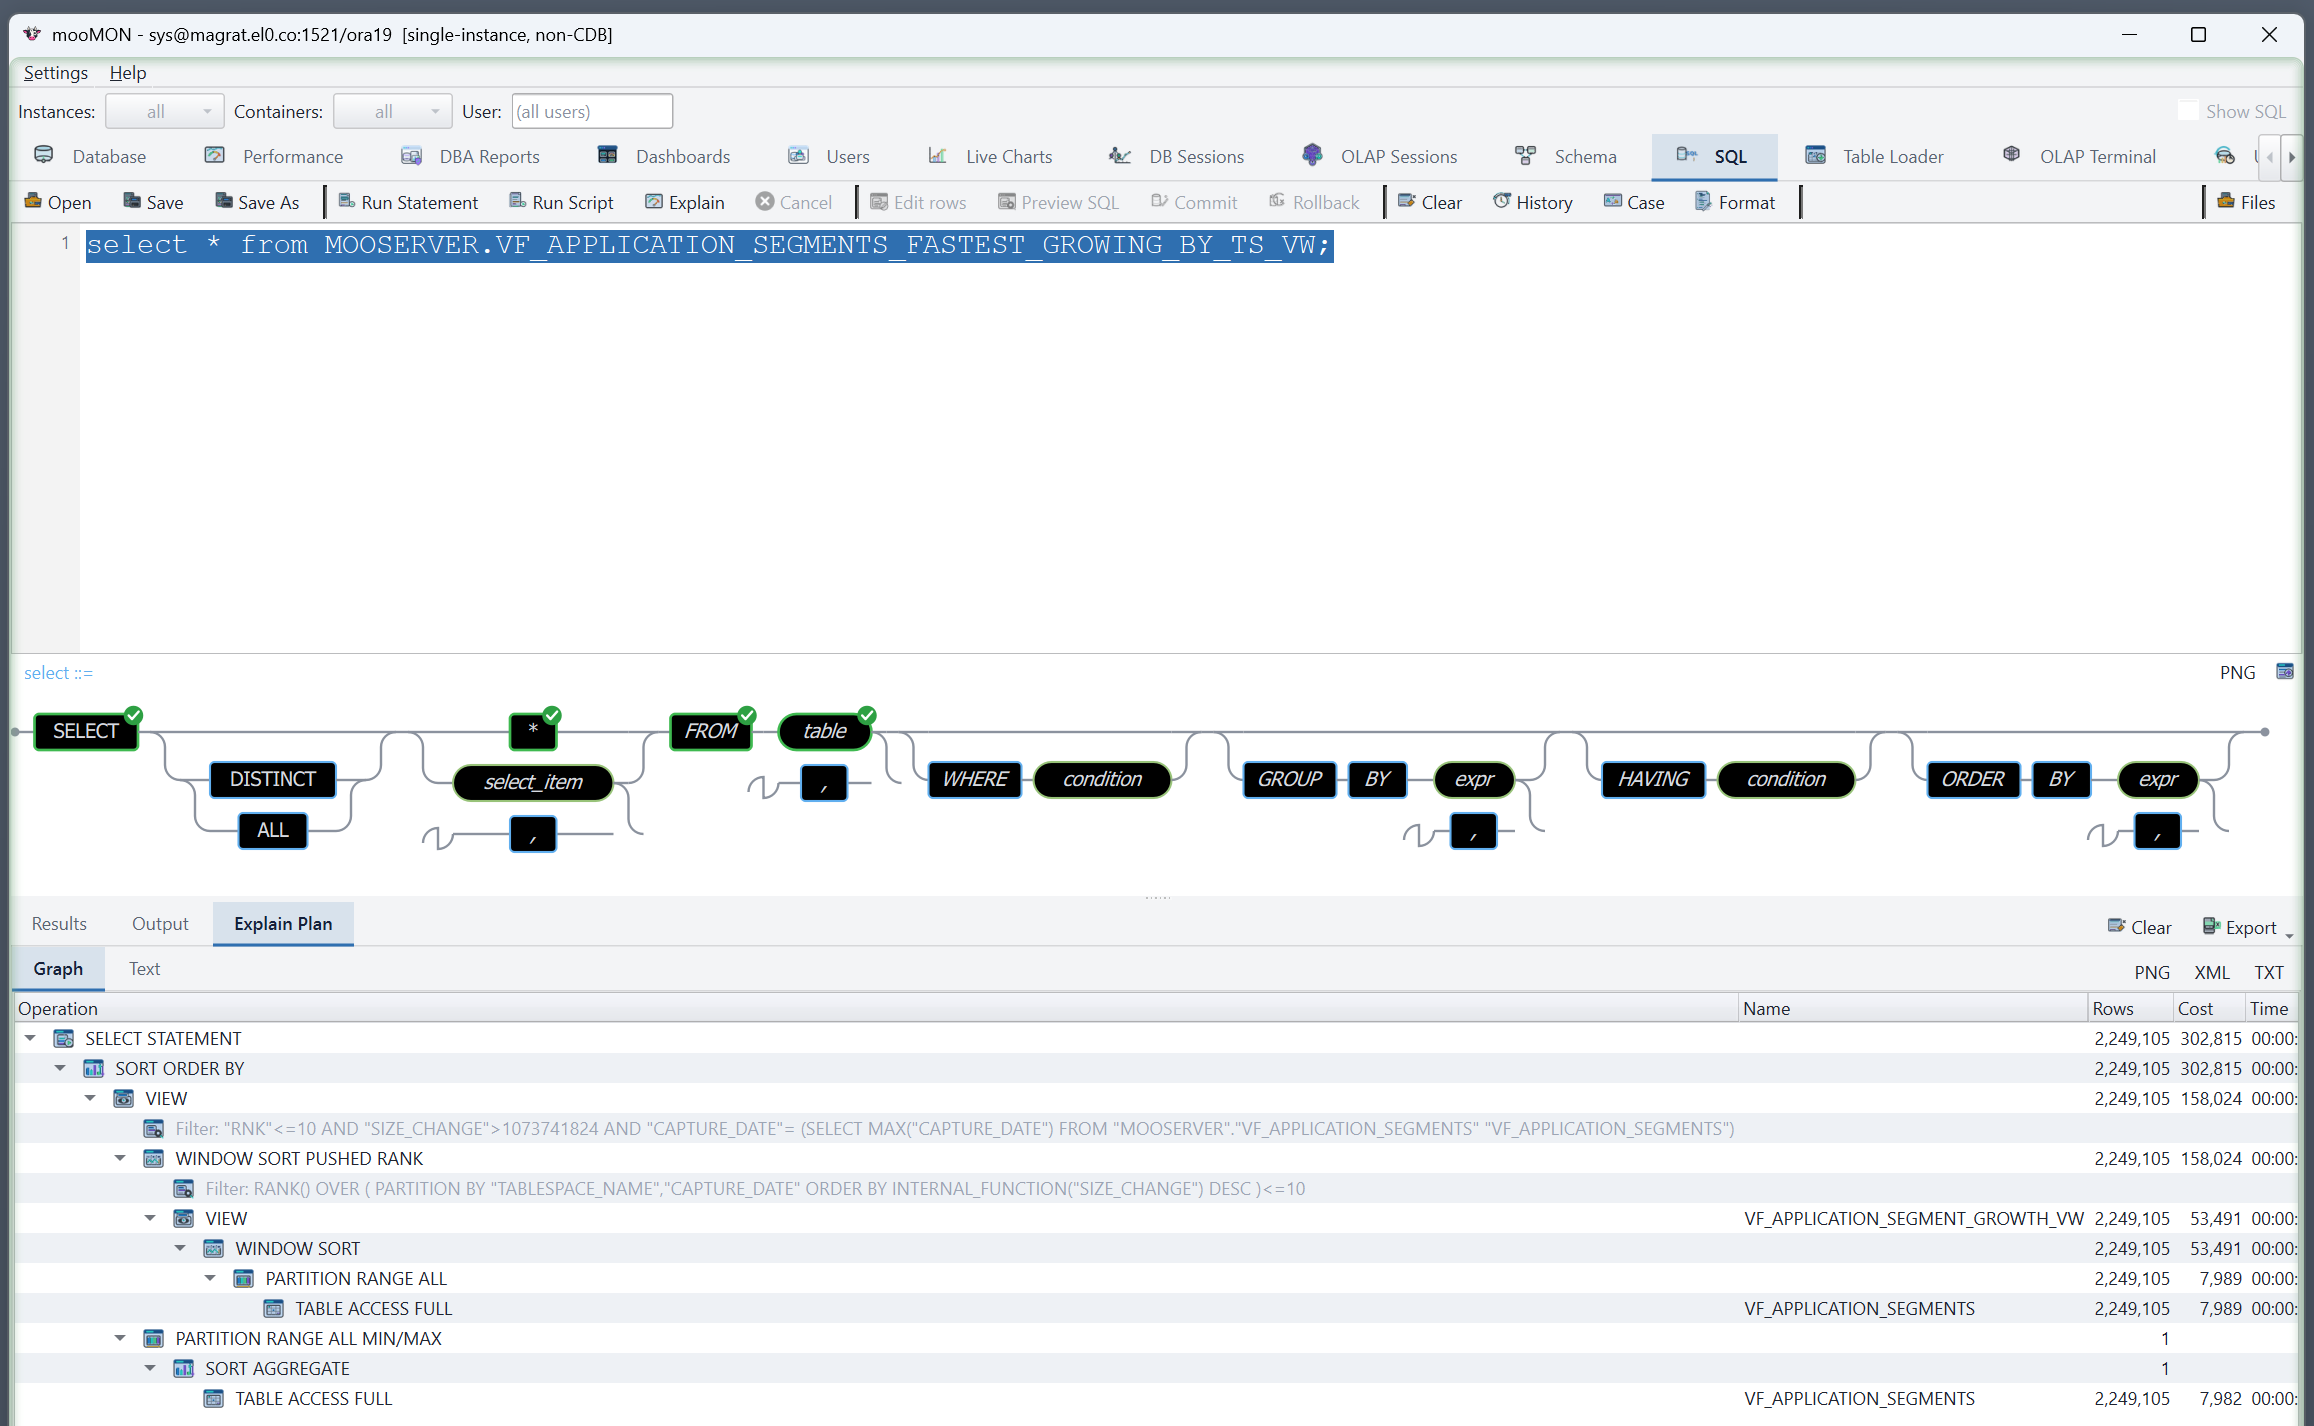
One click produces an Explain Plan for the statement. Below the editor, a live railroad diagram draws the grammar of the statement under your cursor — a quick way to see the shape of a query and spot a missing clause.

AI — ask in plain English
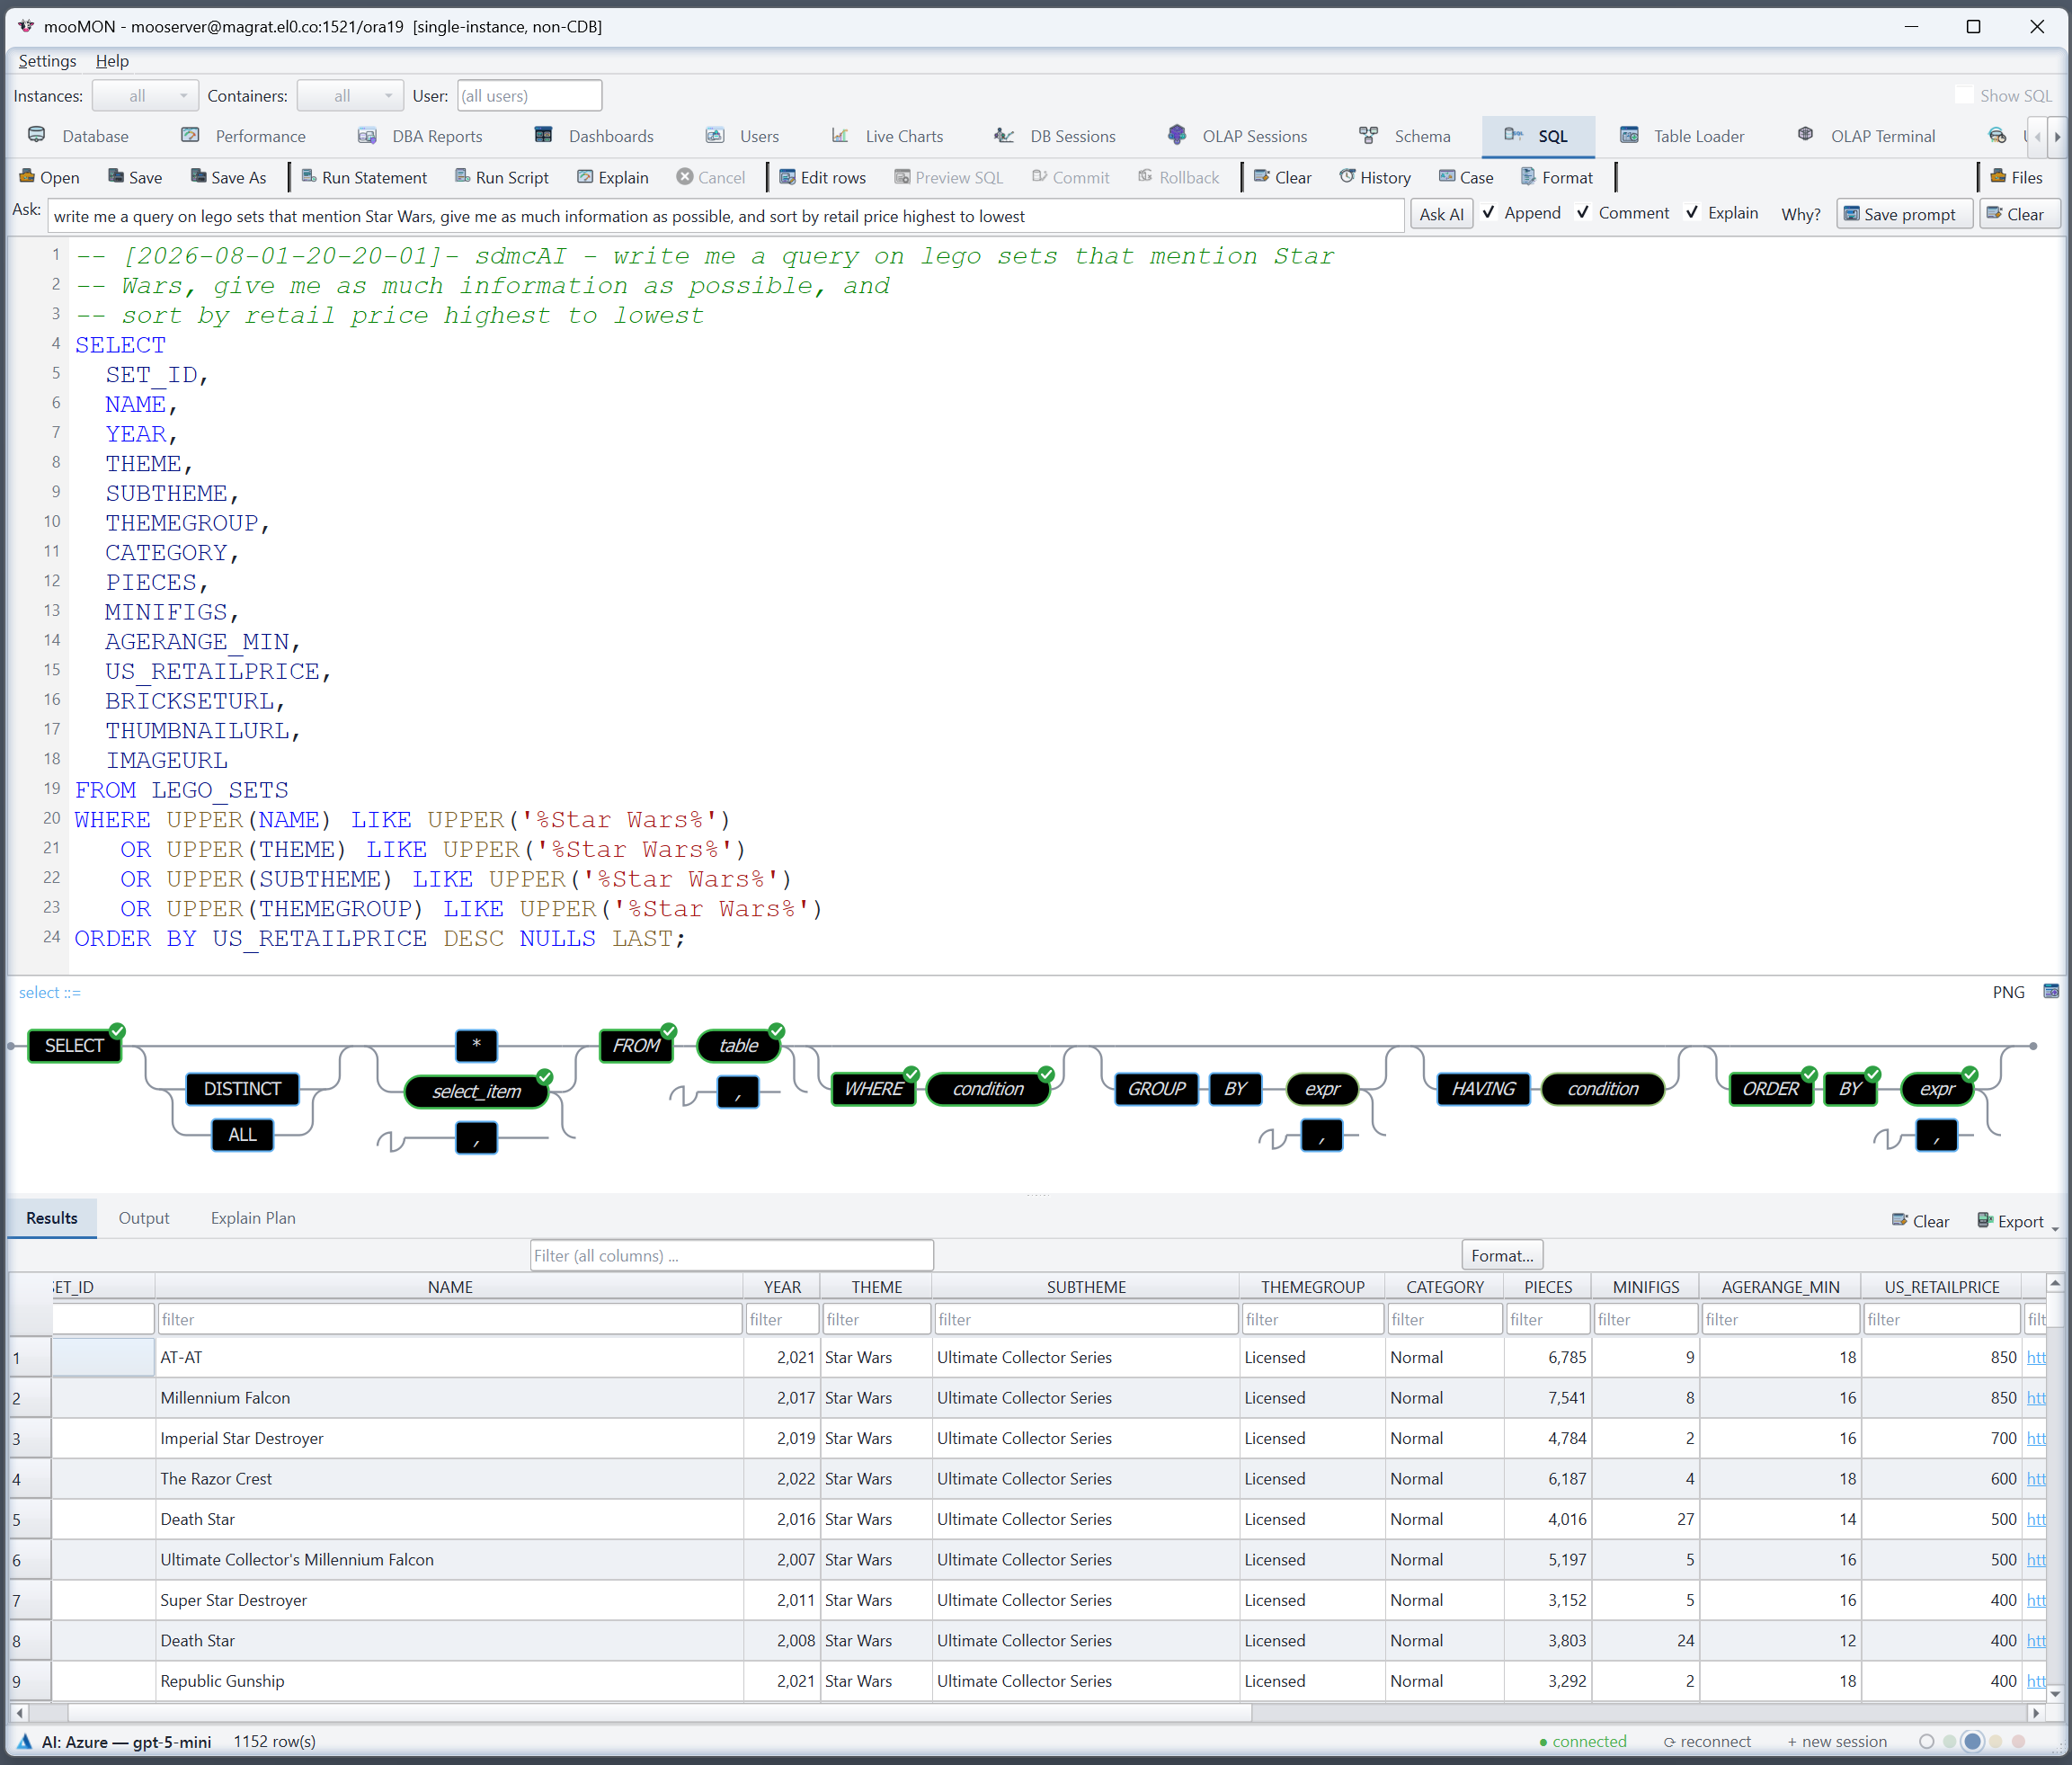
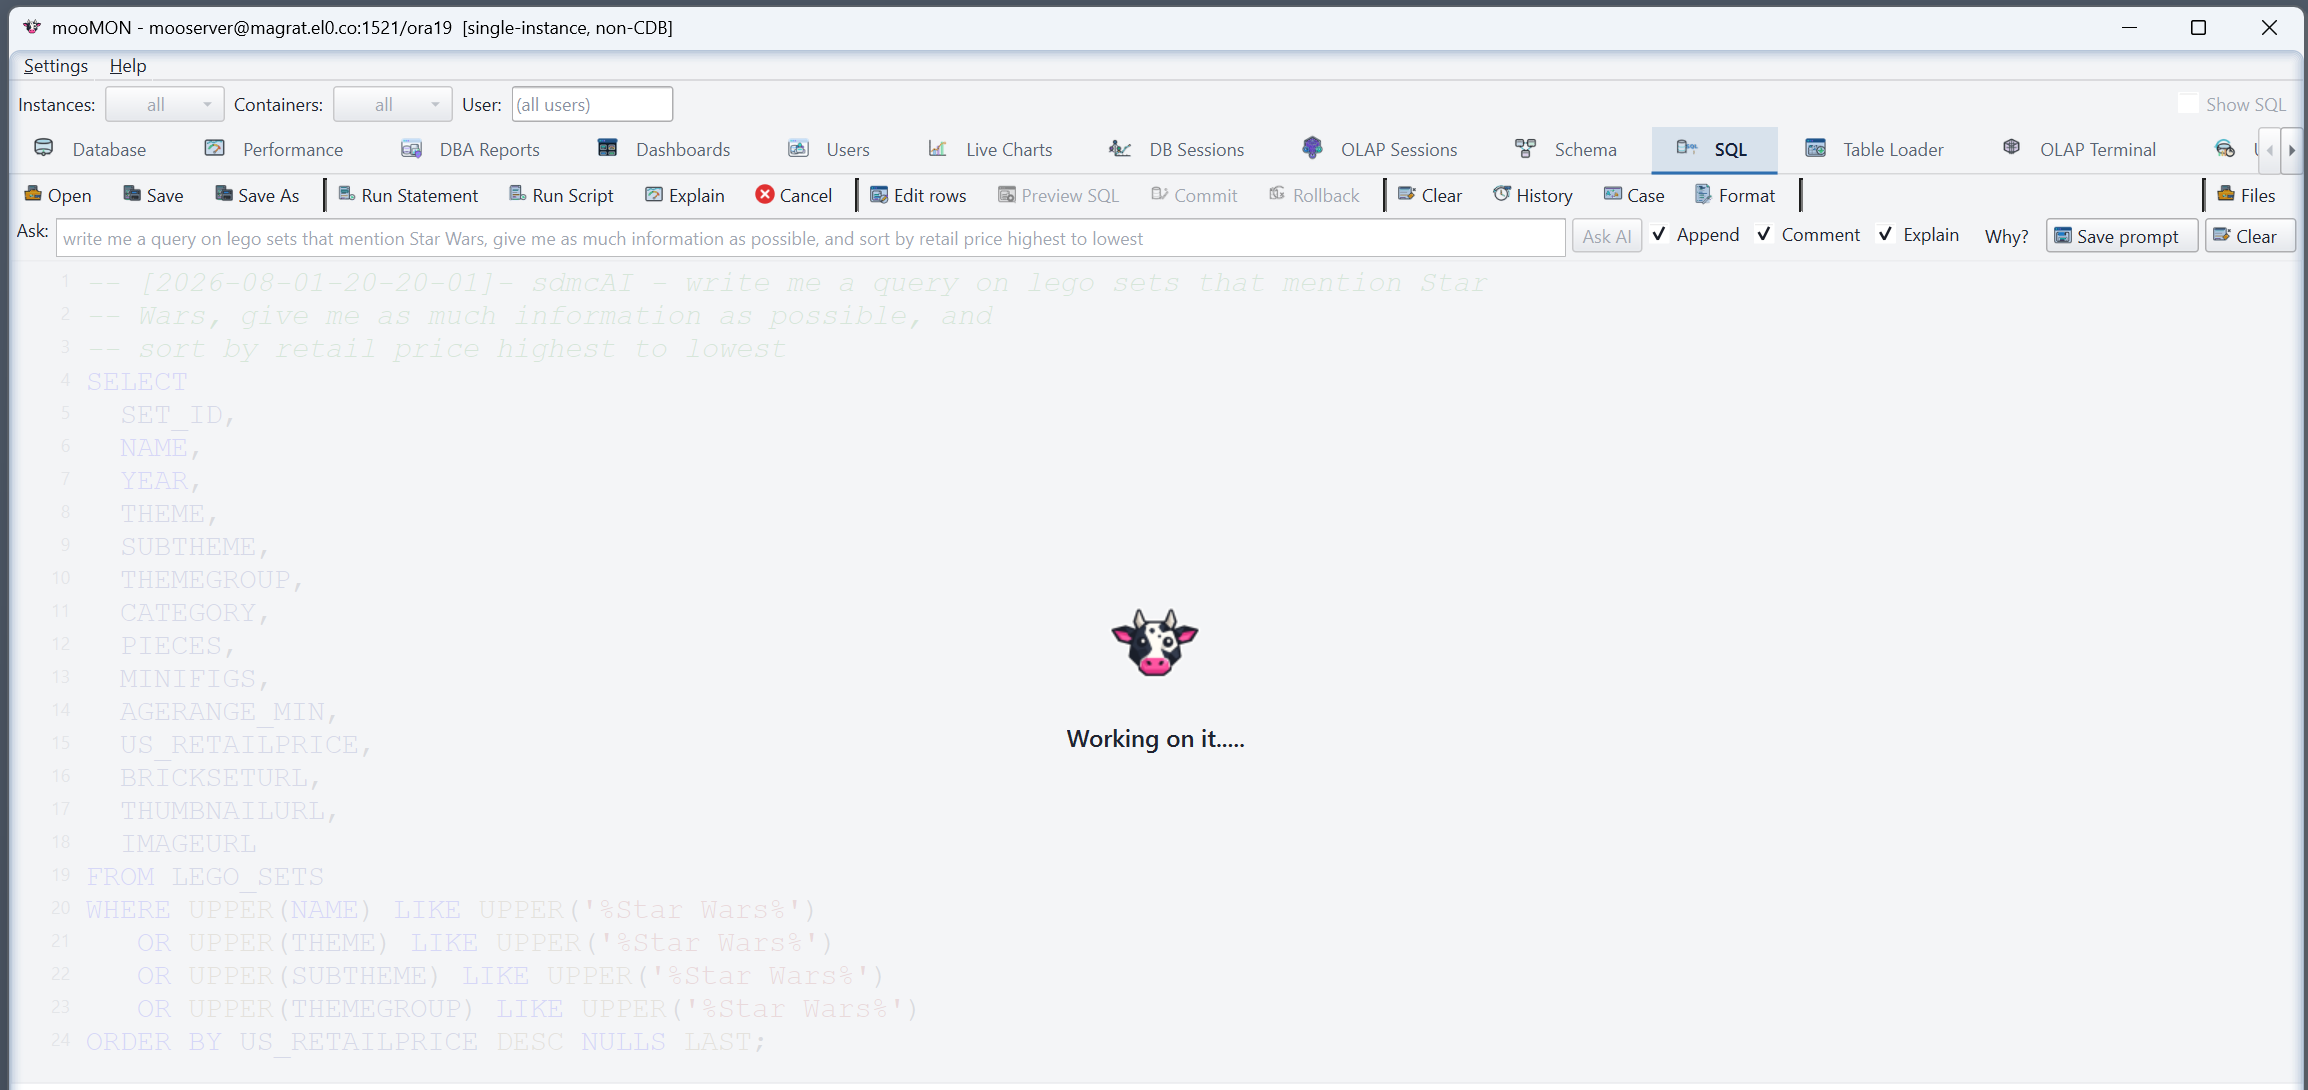
When a connection has the AI assistant enabled, an Ask bar sits above the SQL editor. Type a question the way you'd say it out loud — "which range rover models sold most in GB in 2020, with the customer account name" — and mooMON writes a matching Oracle SELECT straight into the editor, ready to run.

A moment later the statement appears — grounded in your real tables and columns, not guessed. Read it, tweak it, run it.
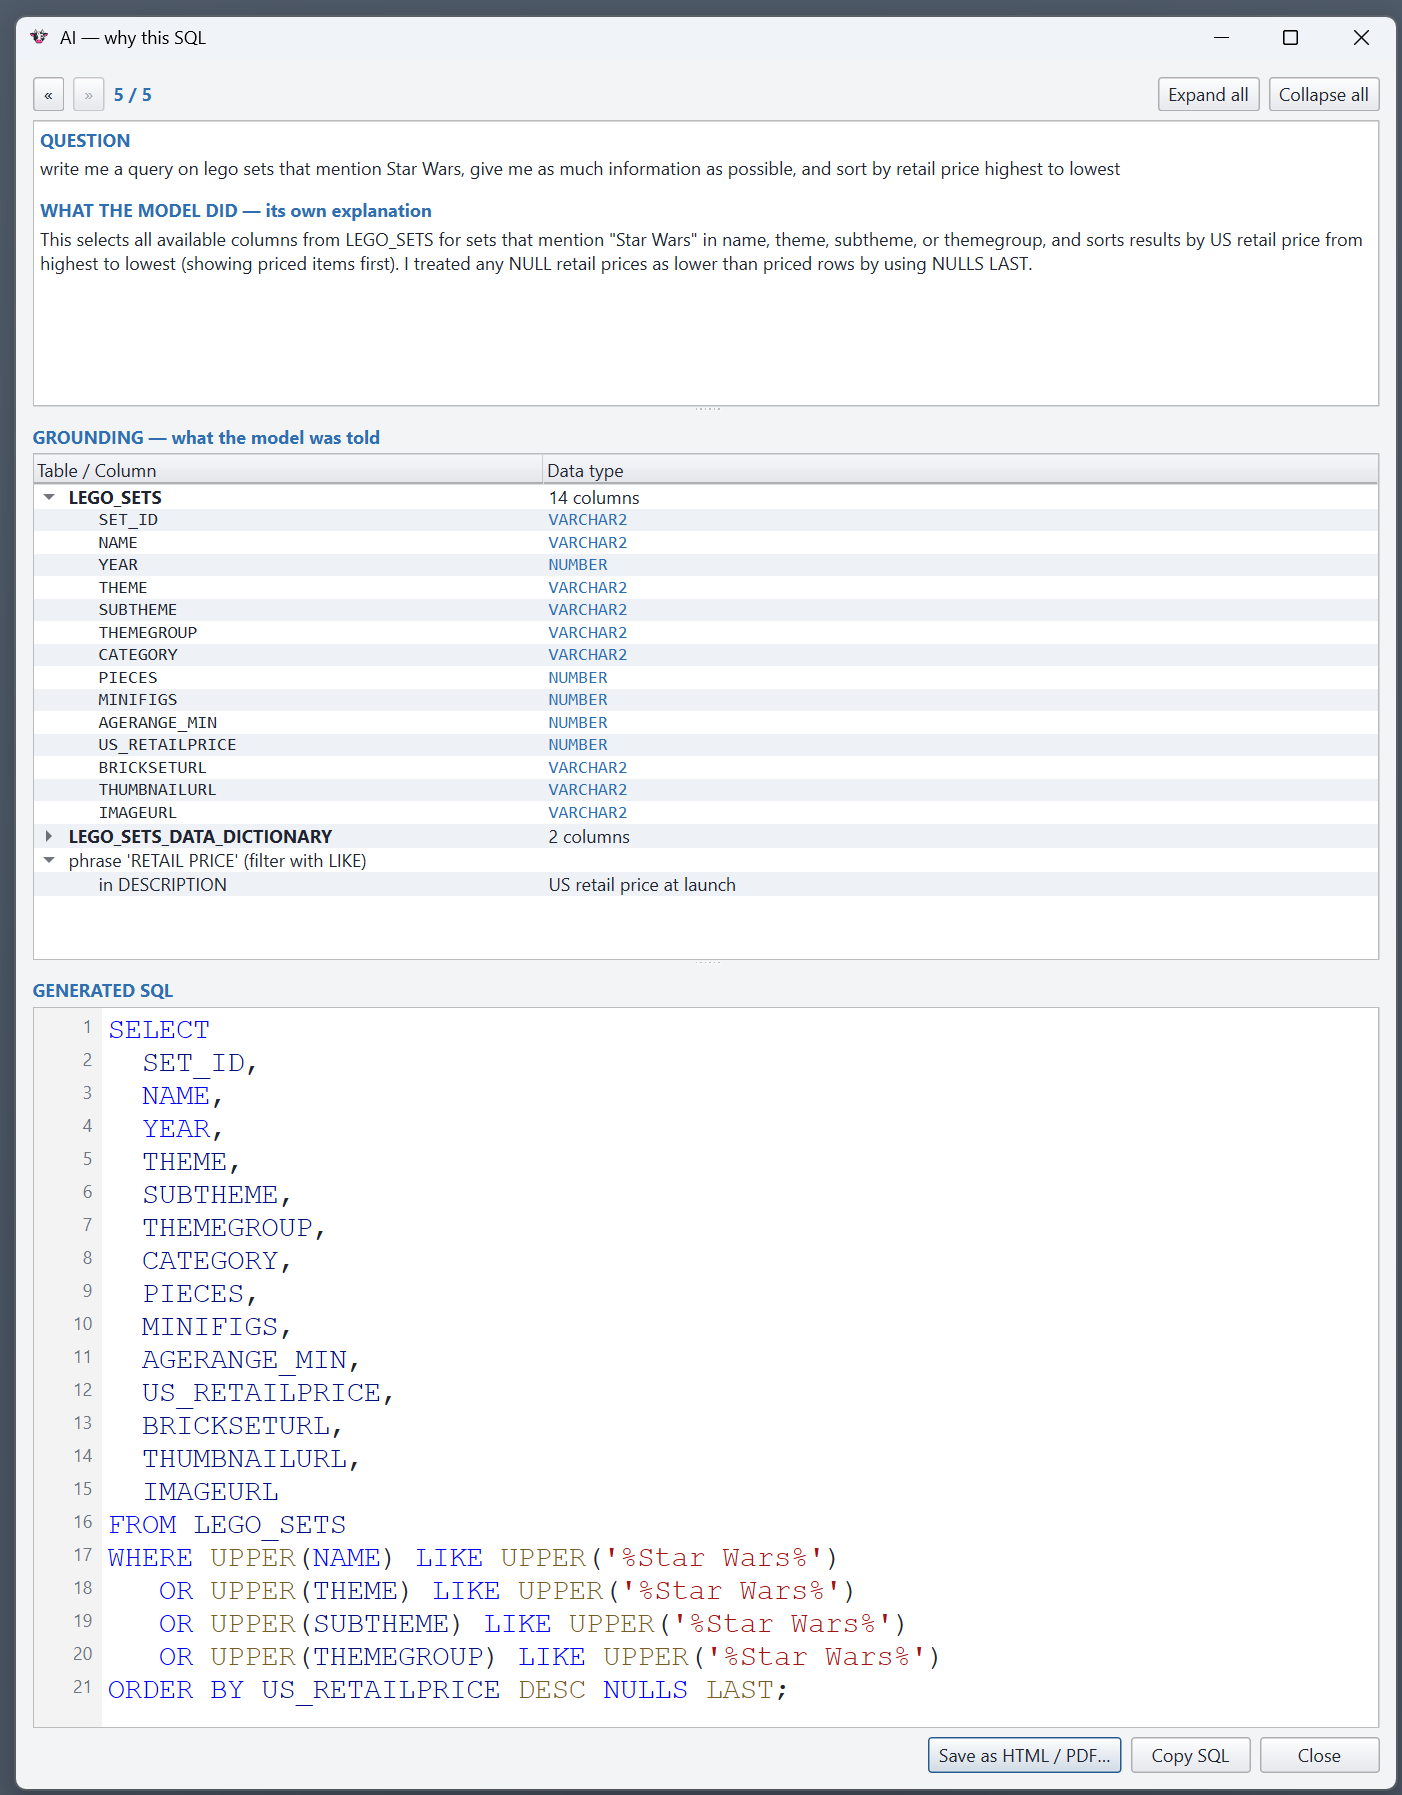
Grounded — and it shows its working
The model isn't left to guess your schema. For every question, mooMON looks up the relevant tables, columns, data types and comments in your live database and hands those to the model as grounding. The Why? button opens a window that lays it all out: the question, the model's own plain-English explanation, exactly what it was told (the grounding tree), and the final SQL.
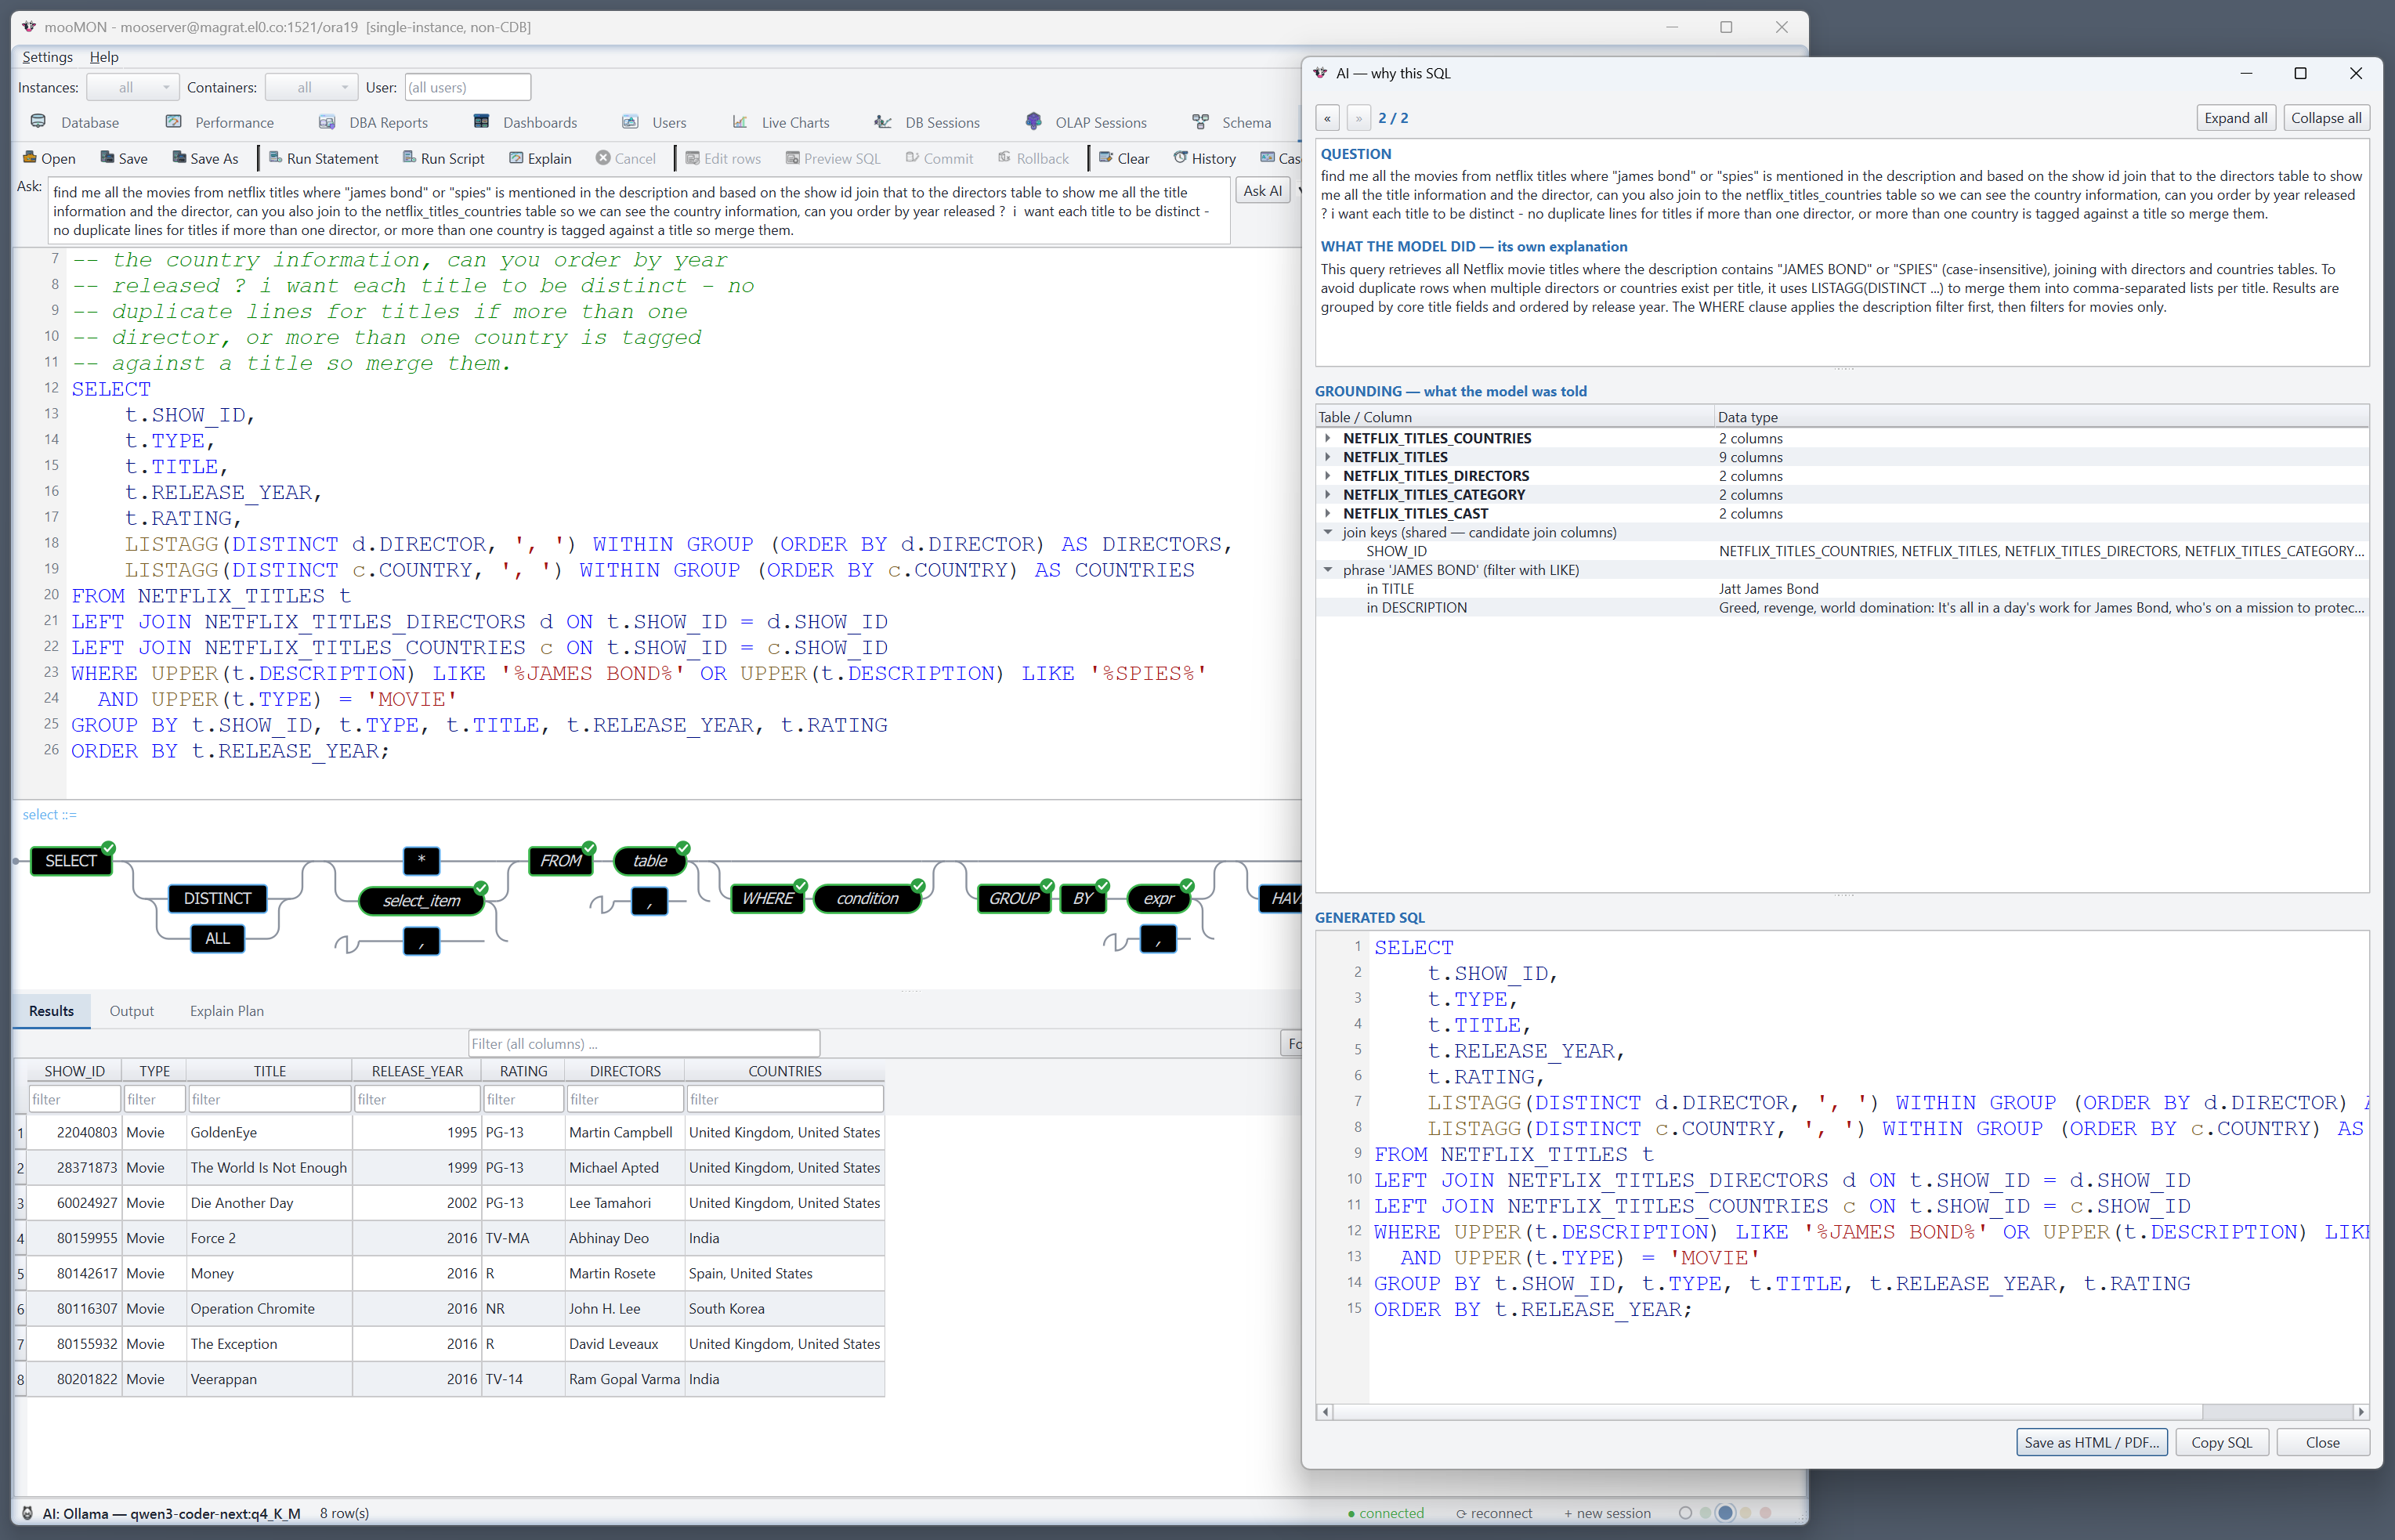
Complex questions, handled
It isn't limited to simple look-ups. Ask for something that needs several tables joined, one-to-many rows collapsed and duplicates merged, and it writes idiomatic Oracle to match — here, two joins plus LISTAGG(DISTINCT …) to fold multiple directors and countries into a single row per title.
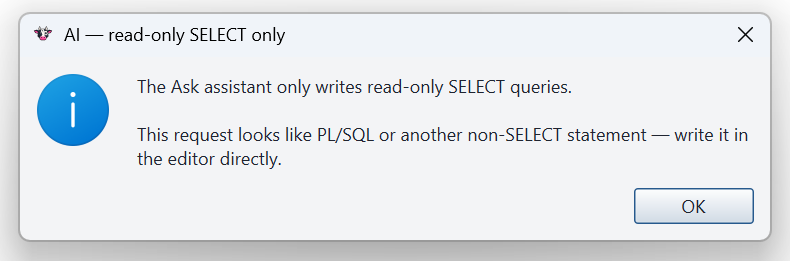
Safe, and honest about its limits
Ask for something that isn't a query — a PL/SQL script, an update, a new table — and mooMON says so plainly rather than inventing something: the assistant writes read-only SELECTs only.
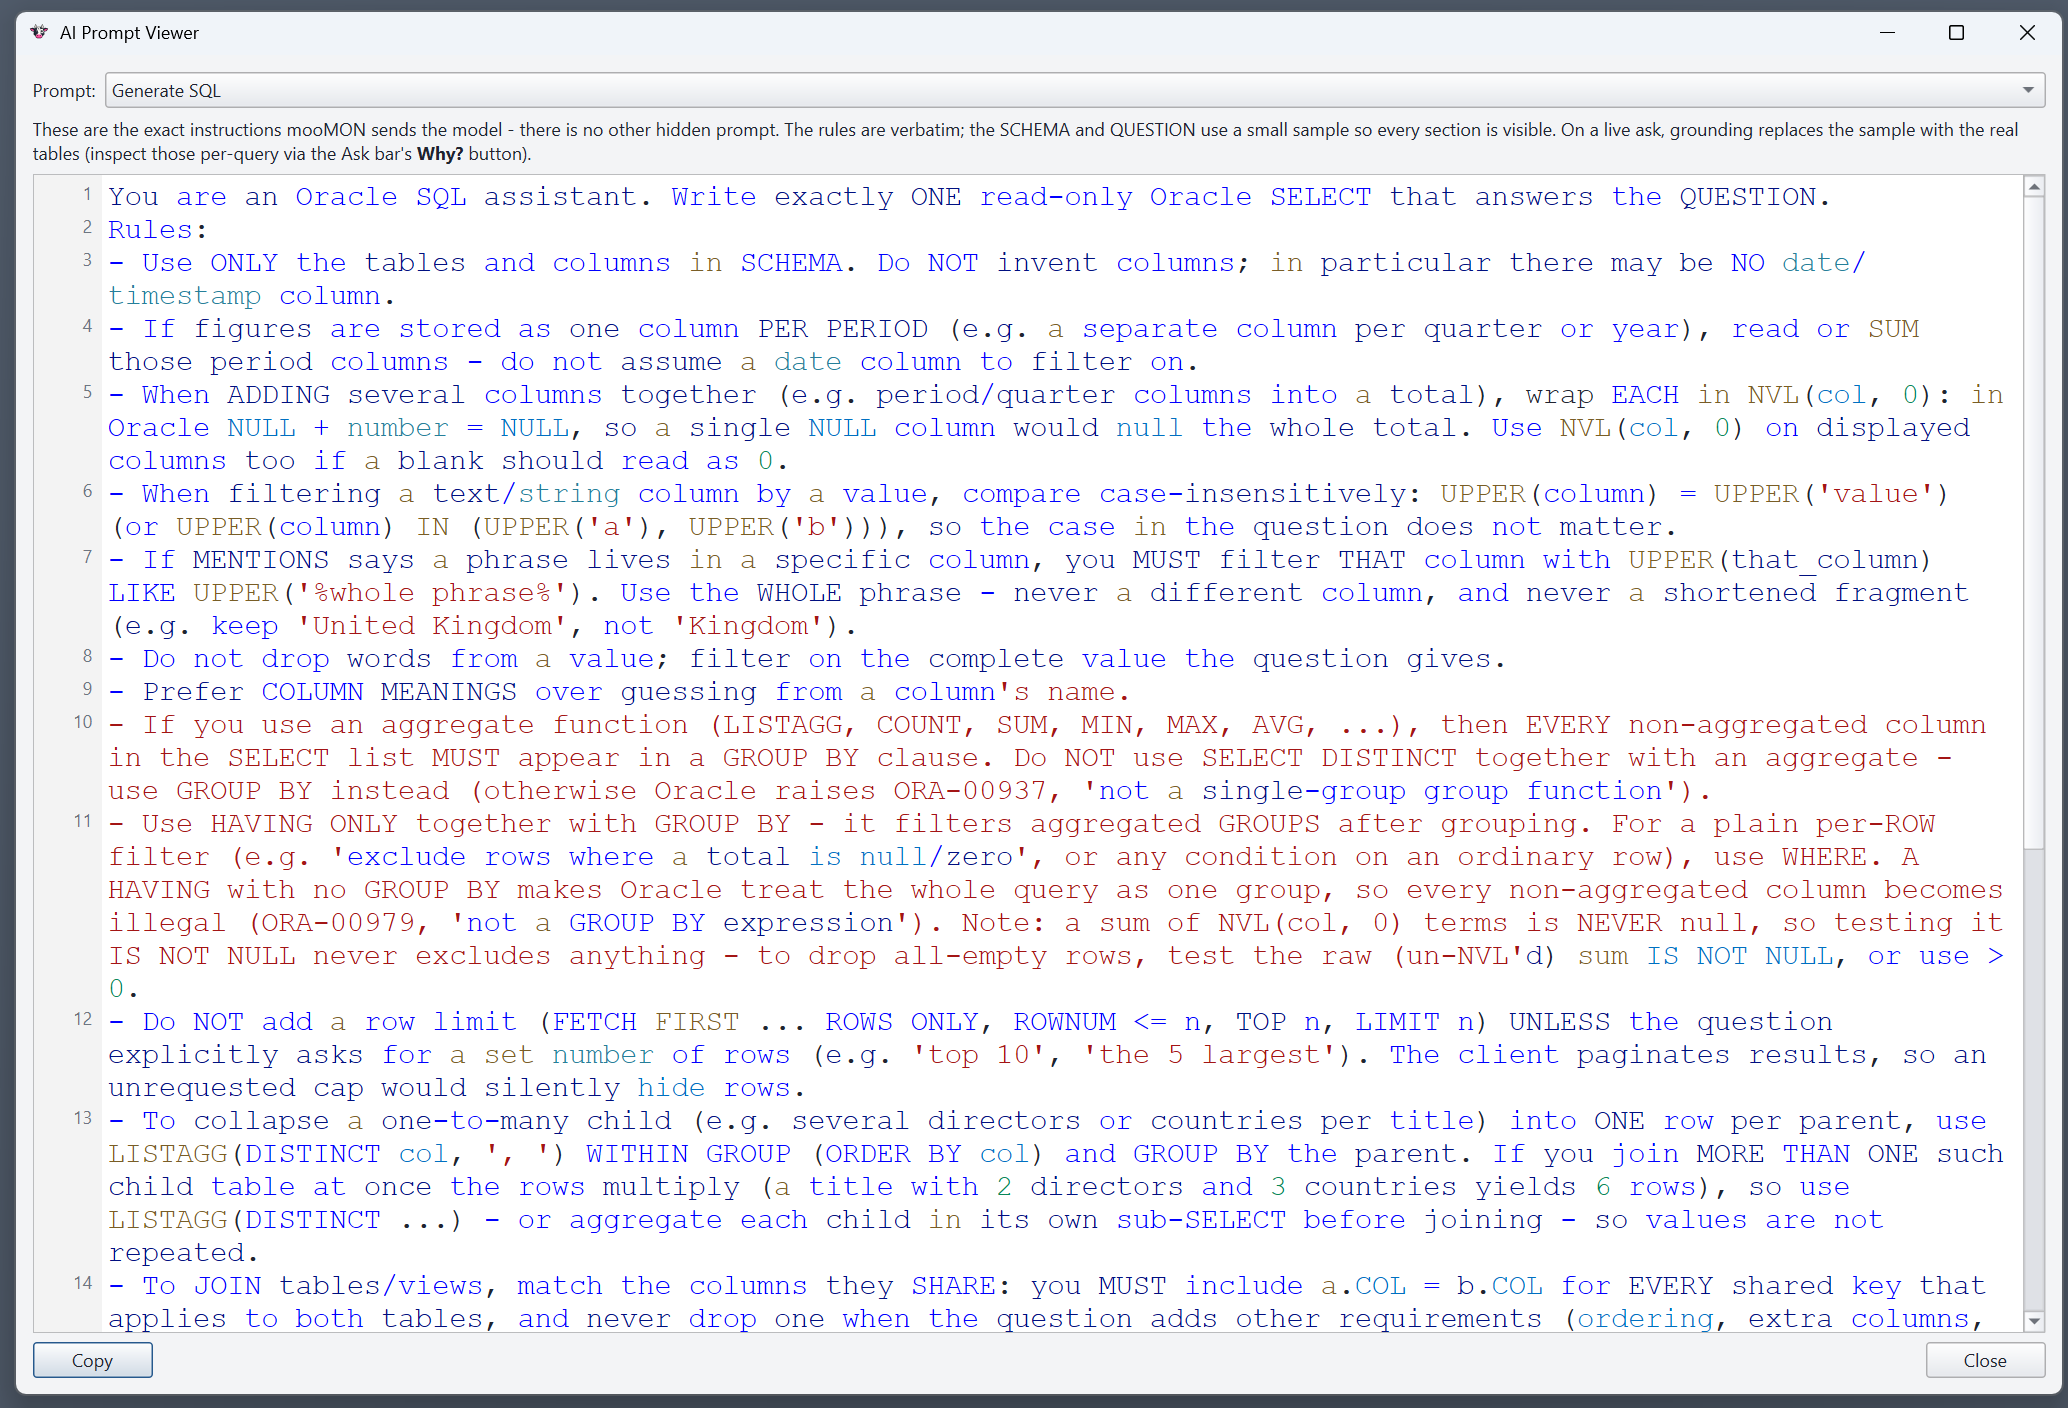
Behind the scenes, deterministic checks verify and tidy every answer — completing a join the model left half-finished, correcting an invalid HAVING, or removing a row cap you didn't ask for — and leave a note in the editor when they've stepped in. And there is no hidden prompt: Settings ▸ AI Prompt Viewer shows the exact instructions mooMON sends the model.
Your AI, your choice — on-prem or Azure
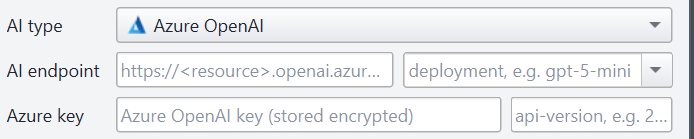
Each connection picks its own AI backend from the AI type dropdown on the connection dialog: Local / Ollama — an on-premises model on your own network (a GPU box, say) — or Azure OpenAI.
Choose Azure and the fields change to the endpoint, deployment, api-version and key. The key is stored encrypted with your master password, exactly like the database password.
Whichever you pick, the footer shows the live backend and model at a glance.

Connect your AI tools — the MCP server
mooMON can act as a server for your favourite AI assistant. Switch it on and tools like Claude (Desktop or CLI), GitHub Copilot and ChatGPT can talk to mooMON over the open Model Context Protocol (MCP) — asking it to run a curated diagnostic script, search your code library, look up an object's source, or run a read-only query, all against the database you choose. Your assistant gains mooMON's knowledge of your estate; mooMON stays firmly in control of what it is allowed to do.
It is the same read-only, safety-first philosophy as the in-app assistant — simply made available to the tools your team already works in.
One line from the connection screen
Open the MCP Server window from the connection dialog. Each saved profile gets its own
connector name (for example moomon-prod) and its own access token, so
you can register several databases side by side and your assistant always knows which one it is
talking to. mooMON hands you the exact line to paste into your terminal:
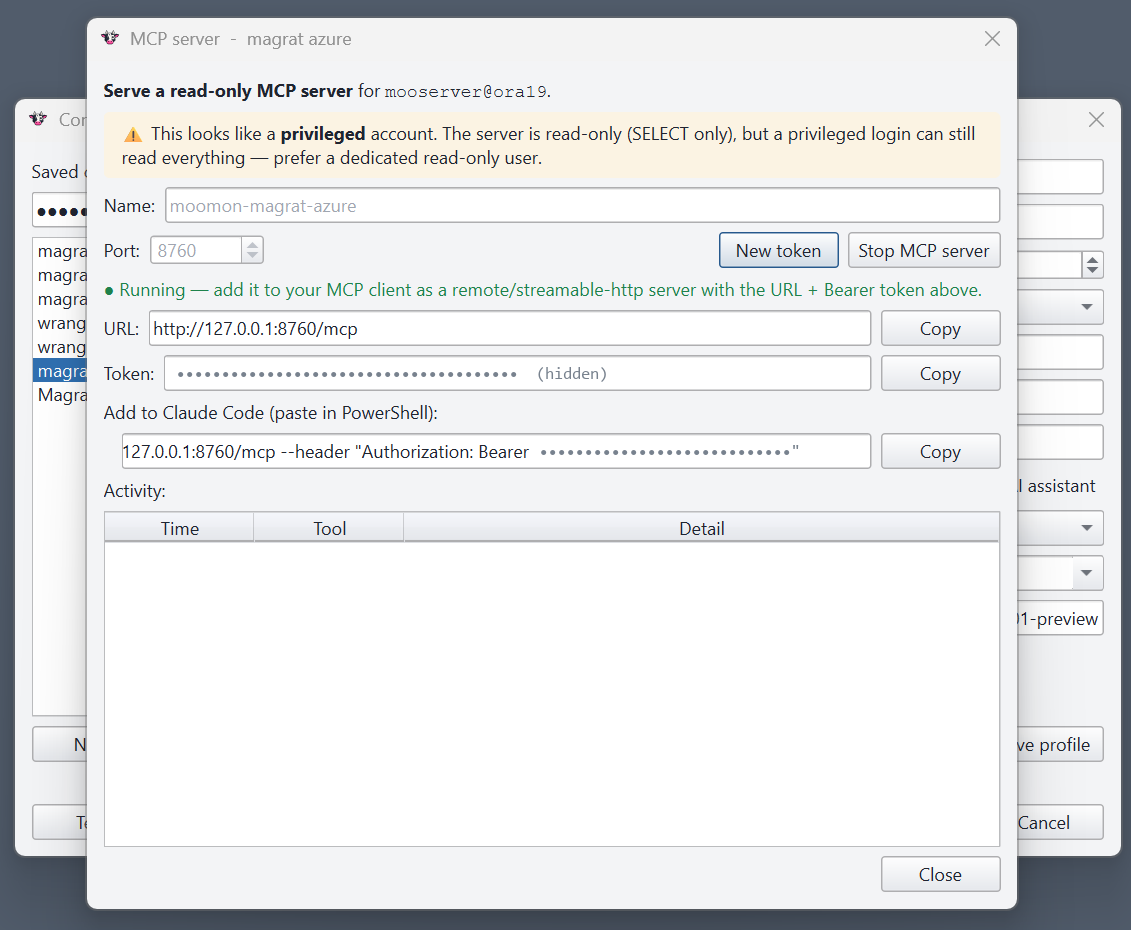
Paste it into PowerShell for the Claude CLI, or point Claude Desktop — or any MCP client — at the same URL and bearer token. The token is per profile; New token rolls it at any time, and nothing connects without it.
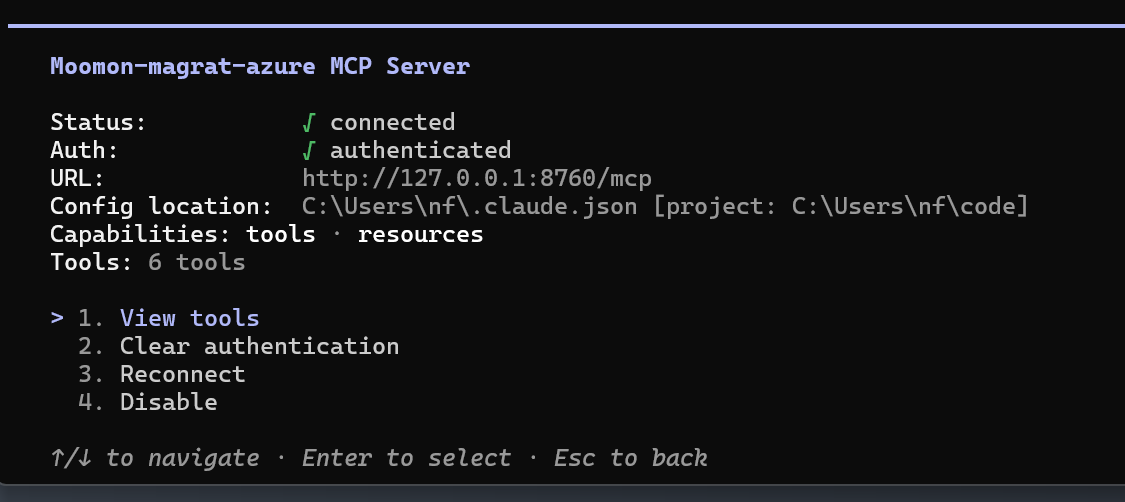
moomon-prod and moomon-dev can both be
registered at once and never cross wires.The six tools — and how you use them
You don't type these tool names yourself. You talk to your assistant in plain English — "what's using the most DB time right now?" — and it picks the right mooMON tool and fills in the details. Knowing what each one does, and what it accepts, tells you exactly what an assistant can reach — and lets you be explicit when you want to ("use run_readonly_sql to …").
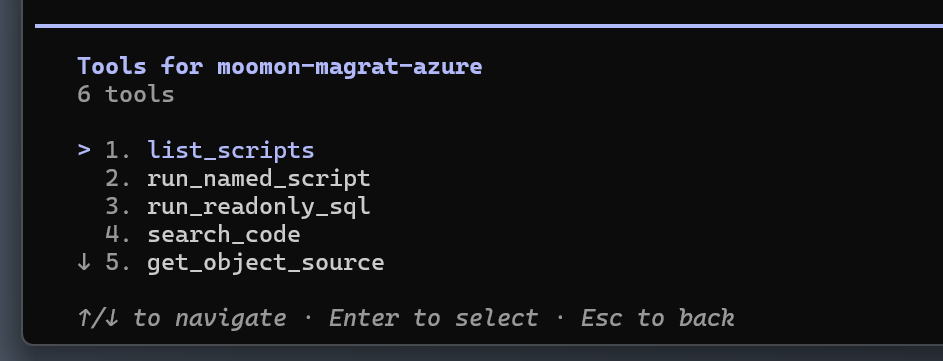
| Tool | What it does | What you give it |
|---|---|---|
| list_scripts | Lists mooMON's curated diagnostic scripts and catalog actions — each with a short description and any values it still needs. | An optional filter — a word matched against the name, label or description
(e.g. undo, top sql). Leave it empty for the full list. |
| run_named_script | Runs one of those scripts, read-only, and returns the rows. Time window and instance default to the last hour across all instances. | The script name (from list_scripts). Optionally hours to widen the window, and
binds — a positional list supplying anything the script still needs, such as a
SQL_ID or AWR snapshot. |
| run_readonly_sql | Runs an ad-hoc query and returns the rows. Guarded by sqlglot: a single
SELECT only — no DML, DDL, PL/SQL, FOR UPDATE or multiple
statements. |
One Oracle SELECT statement. Automatically row-capped; optional max_rows. |
| search_code | Searches the OLAP and relational source library and returns the matching objects with the lines that hit. | A search string. Optionally a tier (both, olap or
relational) and exact to match the text verbatim. |
| get_object_source | Returns the source of an OLAP program or model from the FinanceHub snapshot. | The object name. Optionally an aw (analytic workspace) — omit it to get every AW that holds one of that name. |
| get_dependencies | Shows what an OLAP program references (depends on) and what references it (dependents — the change blast-radius). | The object name, and an optional aw. |
There is also a read-only resource, moomon://catalog, that hands the assistant
the whole grouped catalog of scripts at once — useful for "what can you check on this
database?"
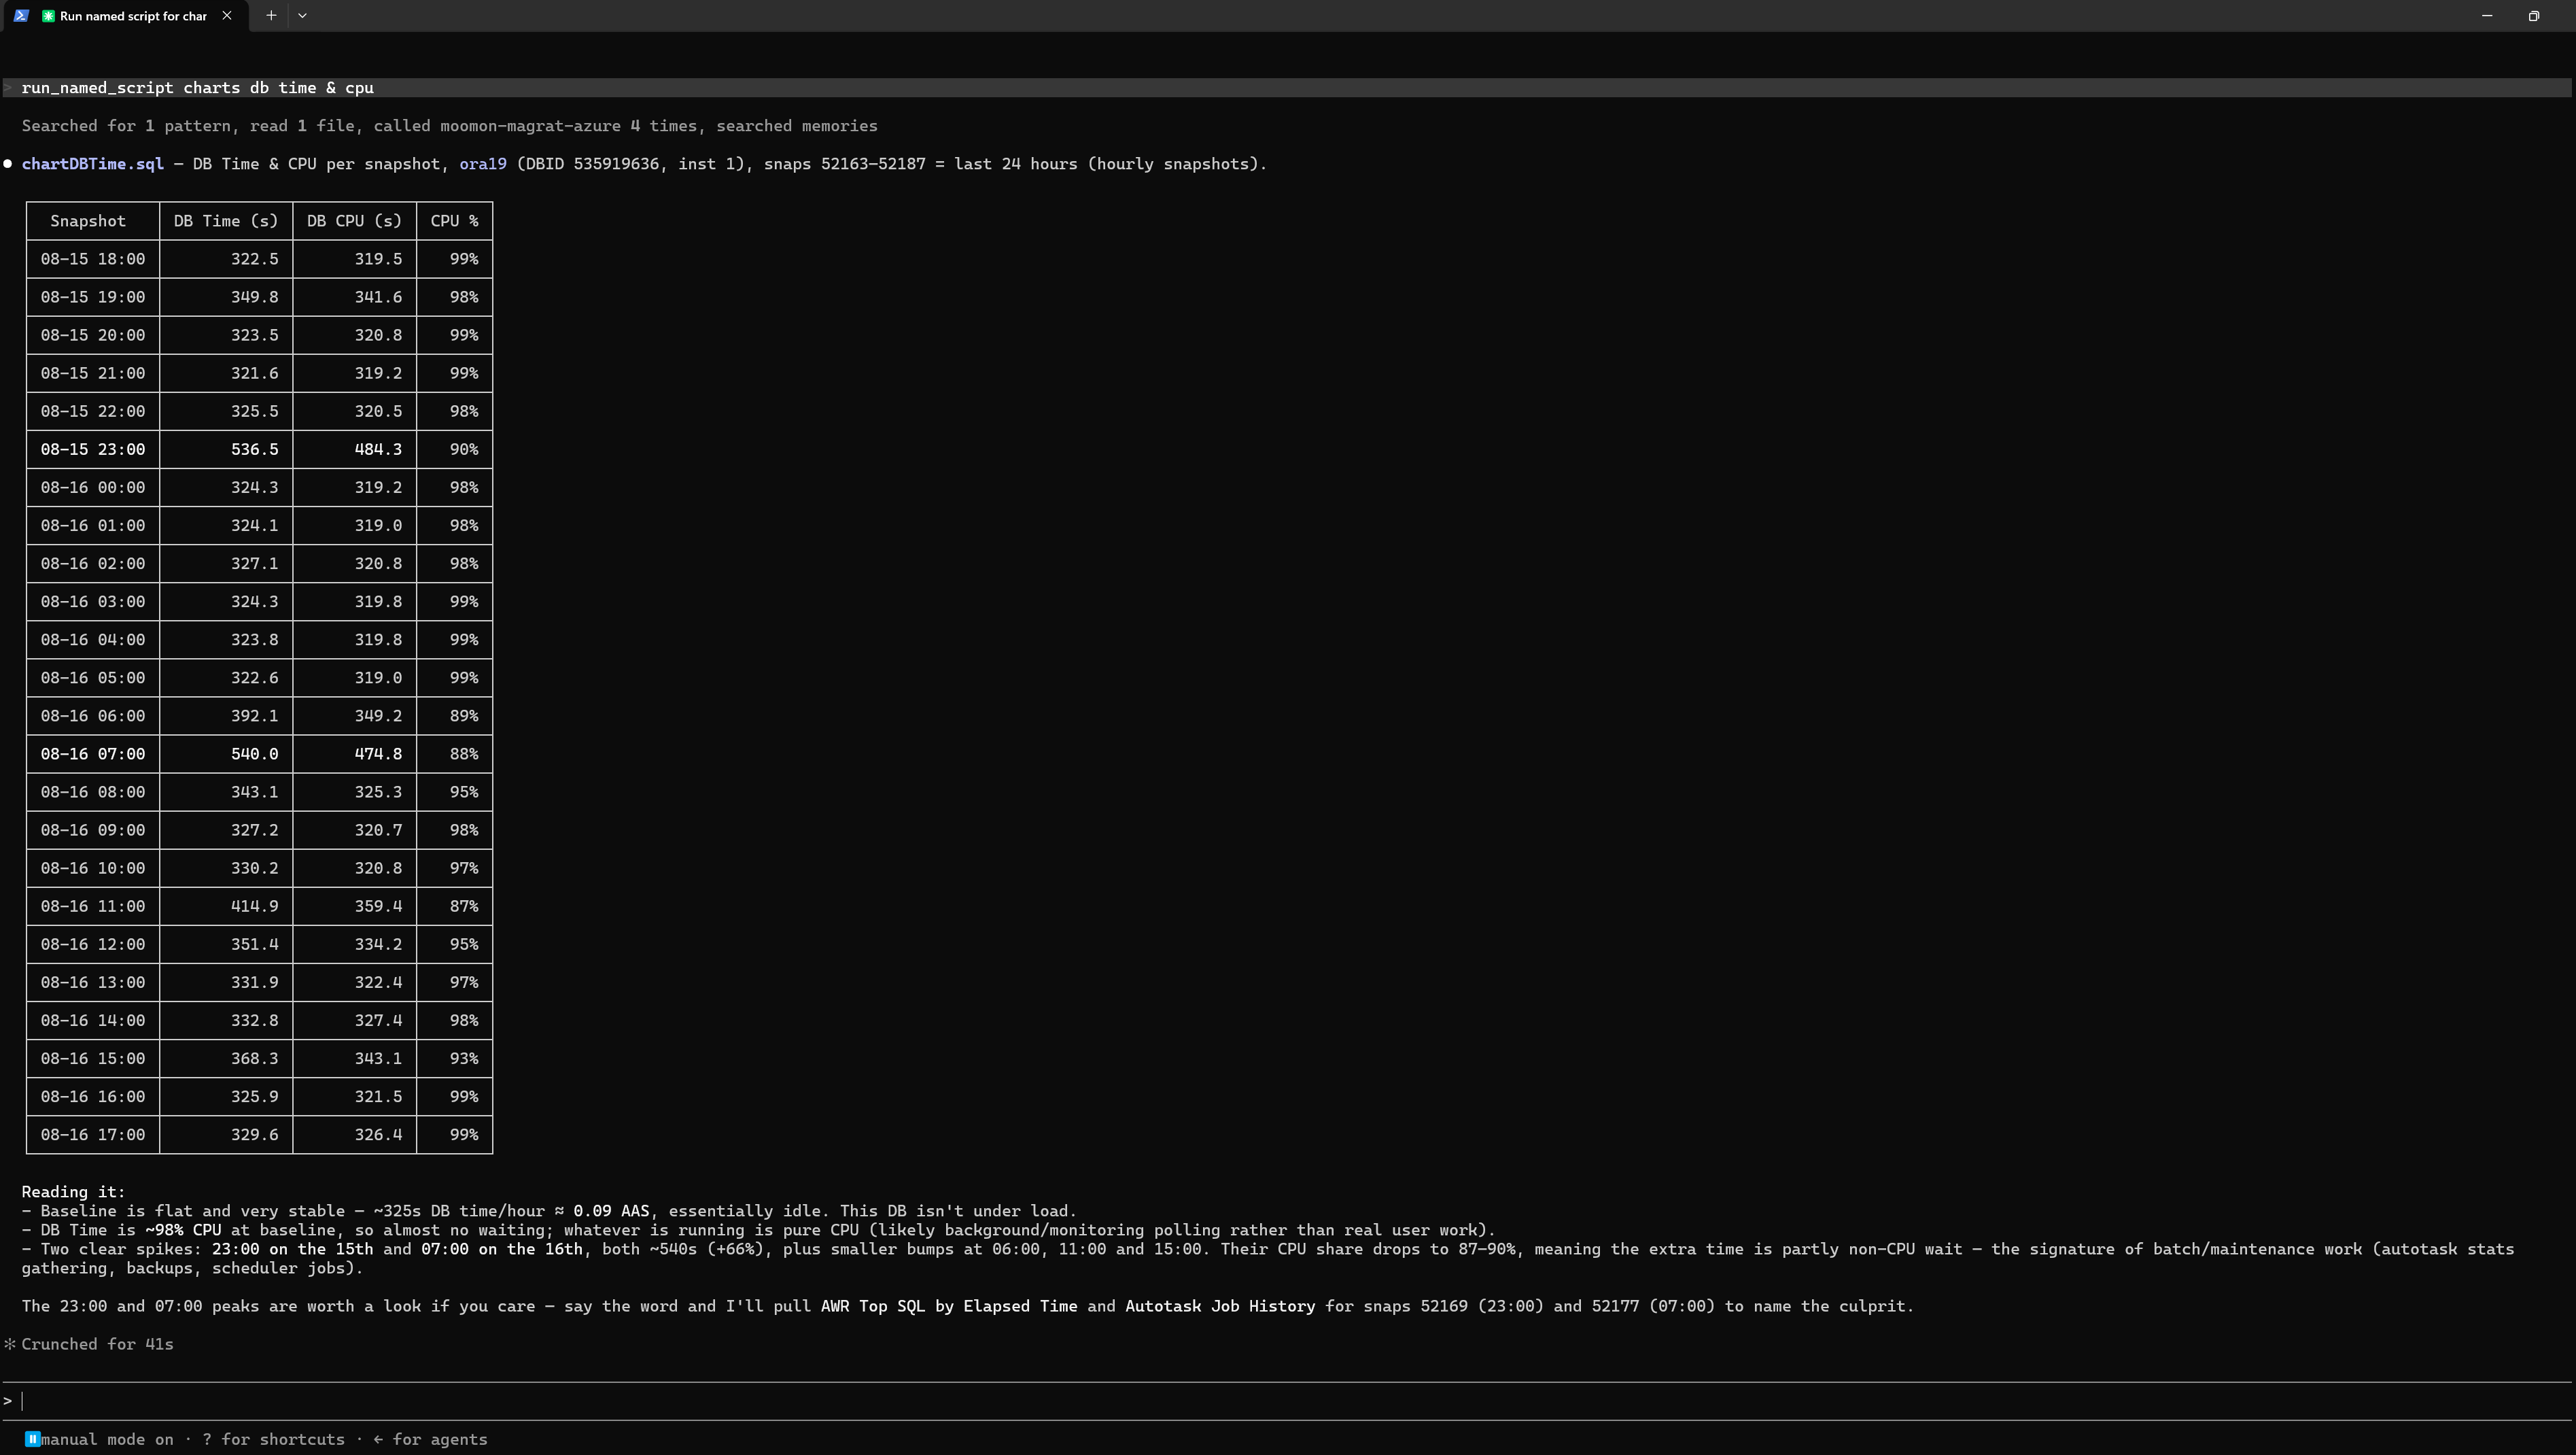
list_scripts, then runs the one you pick
with run_named_script — prompting you for a SQL_ID or snapshot only if
that script needs one.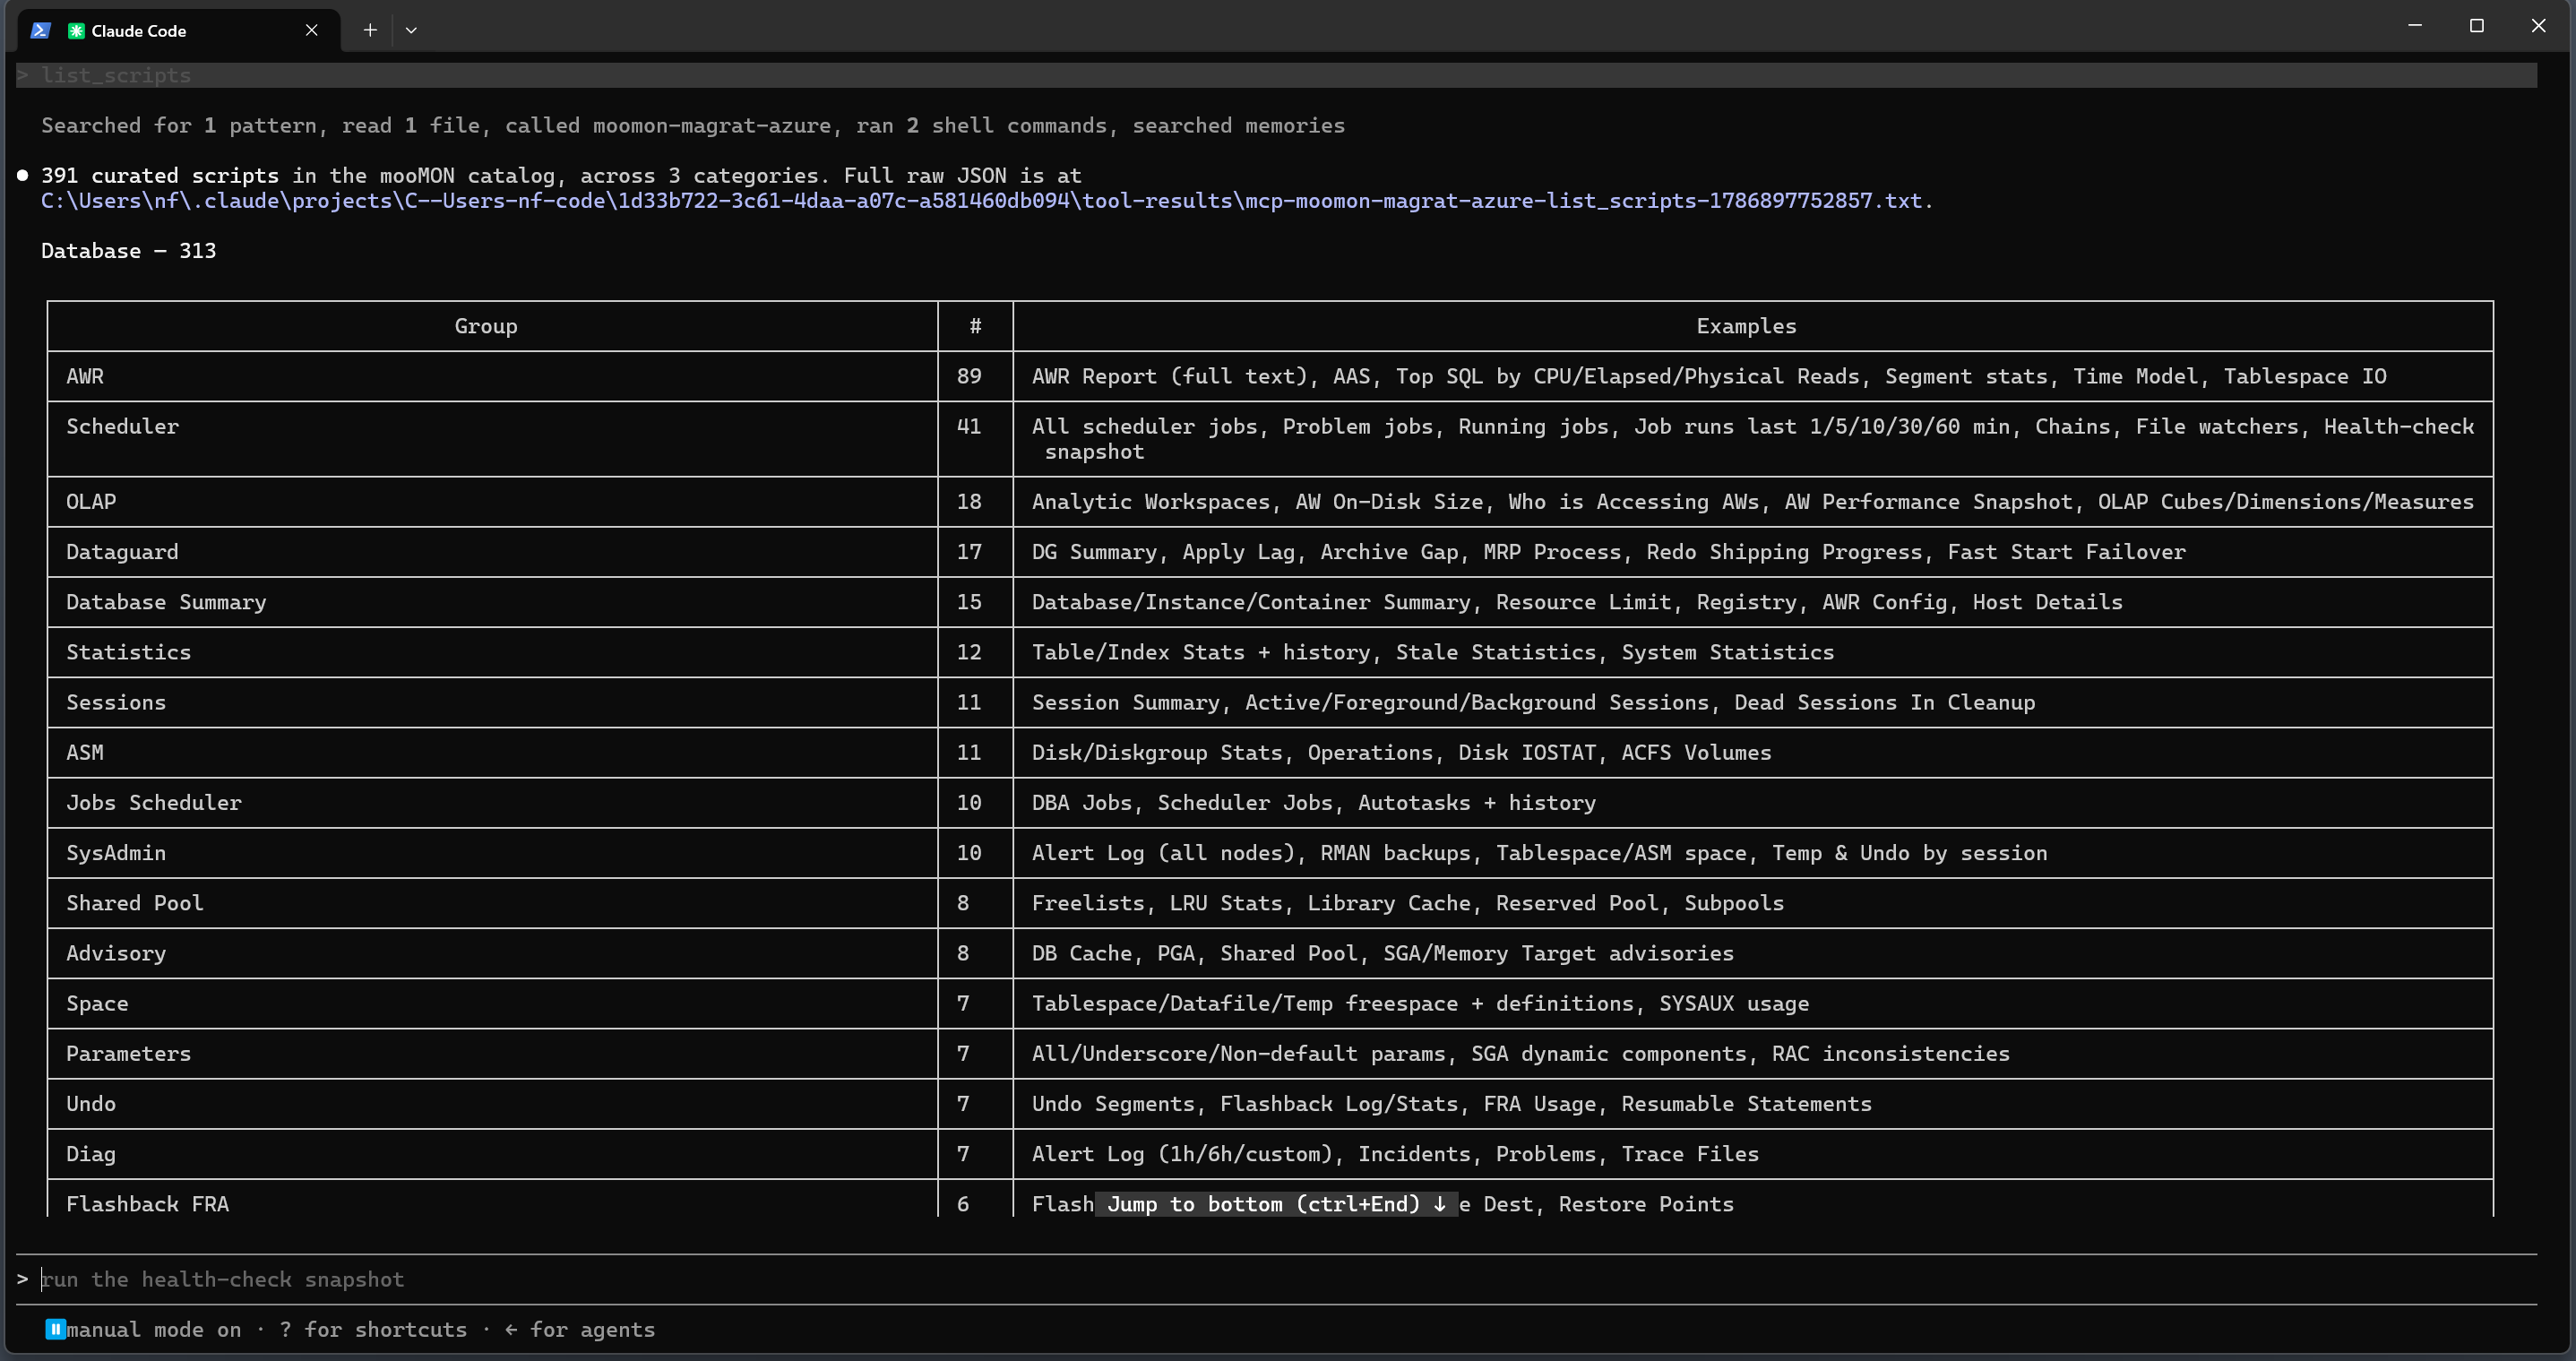
Scoped, read-only and visible
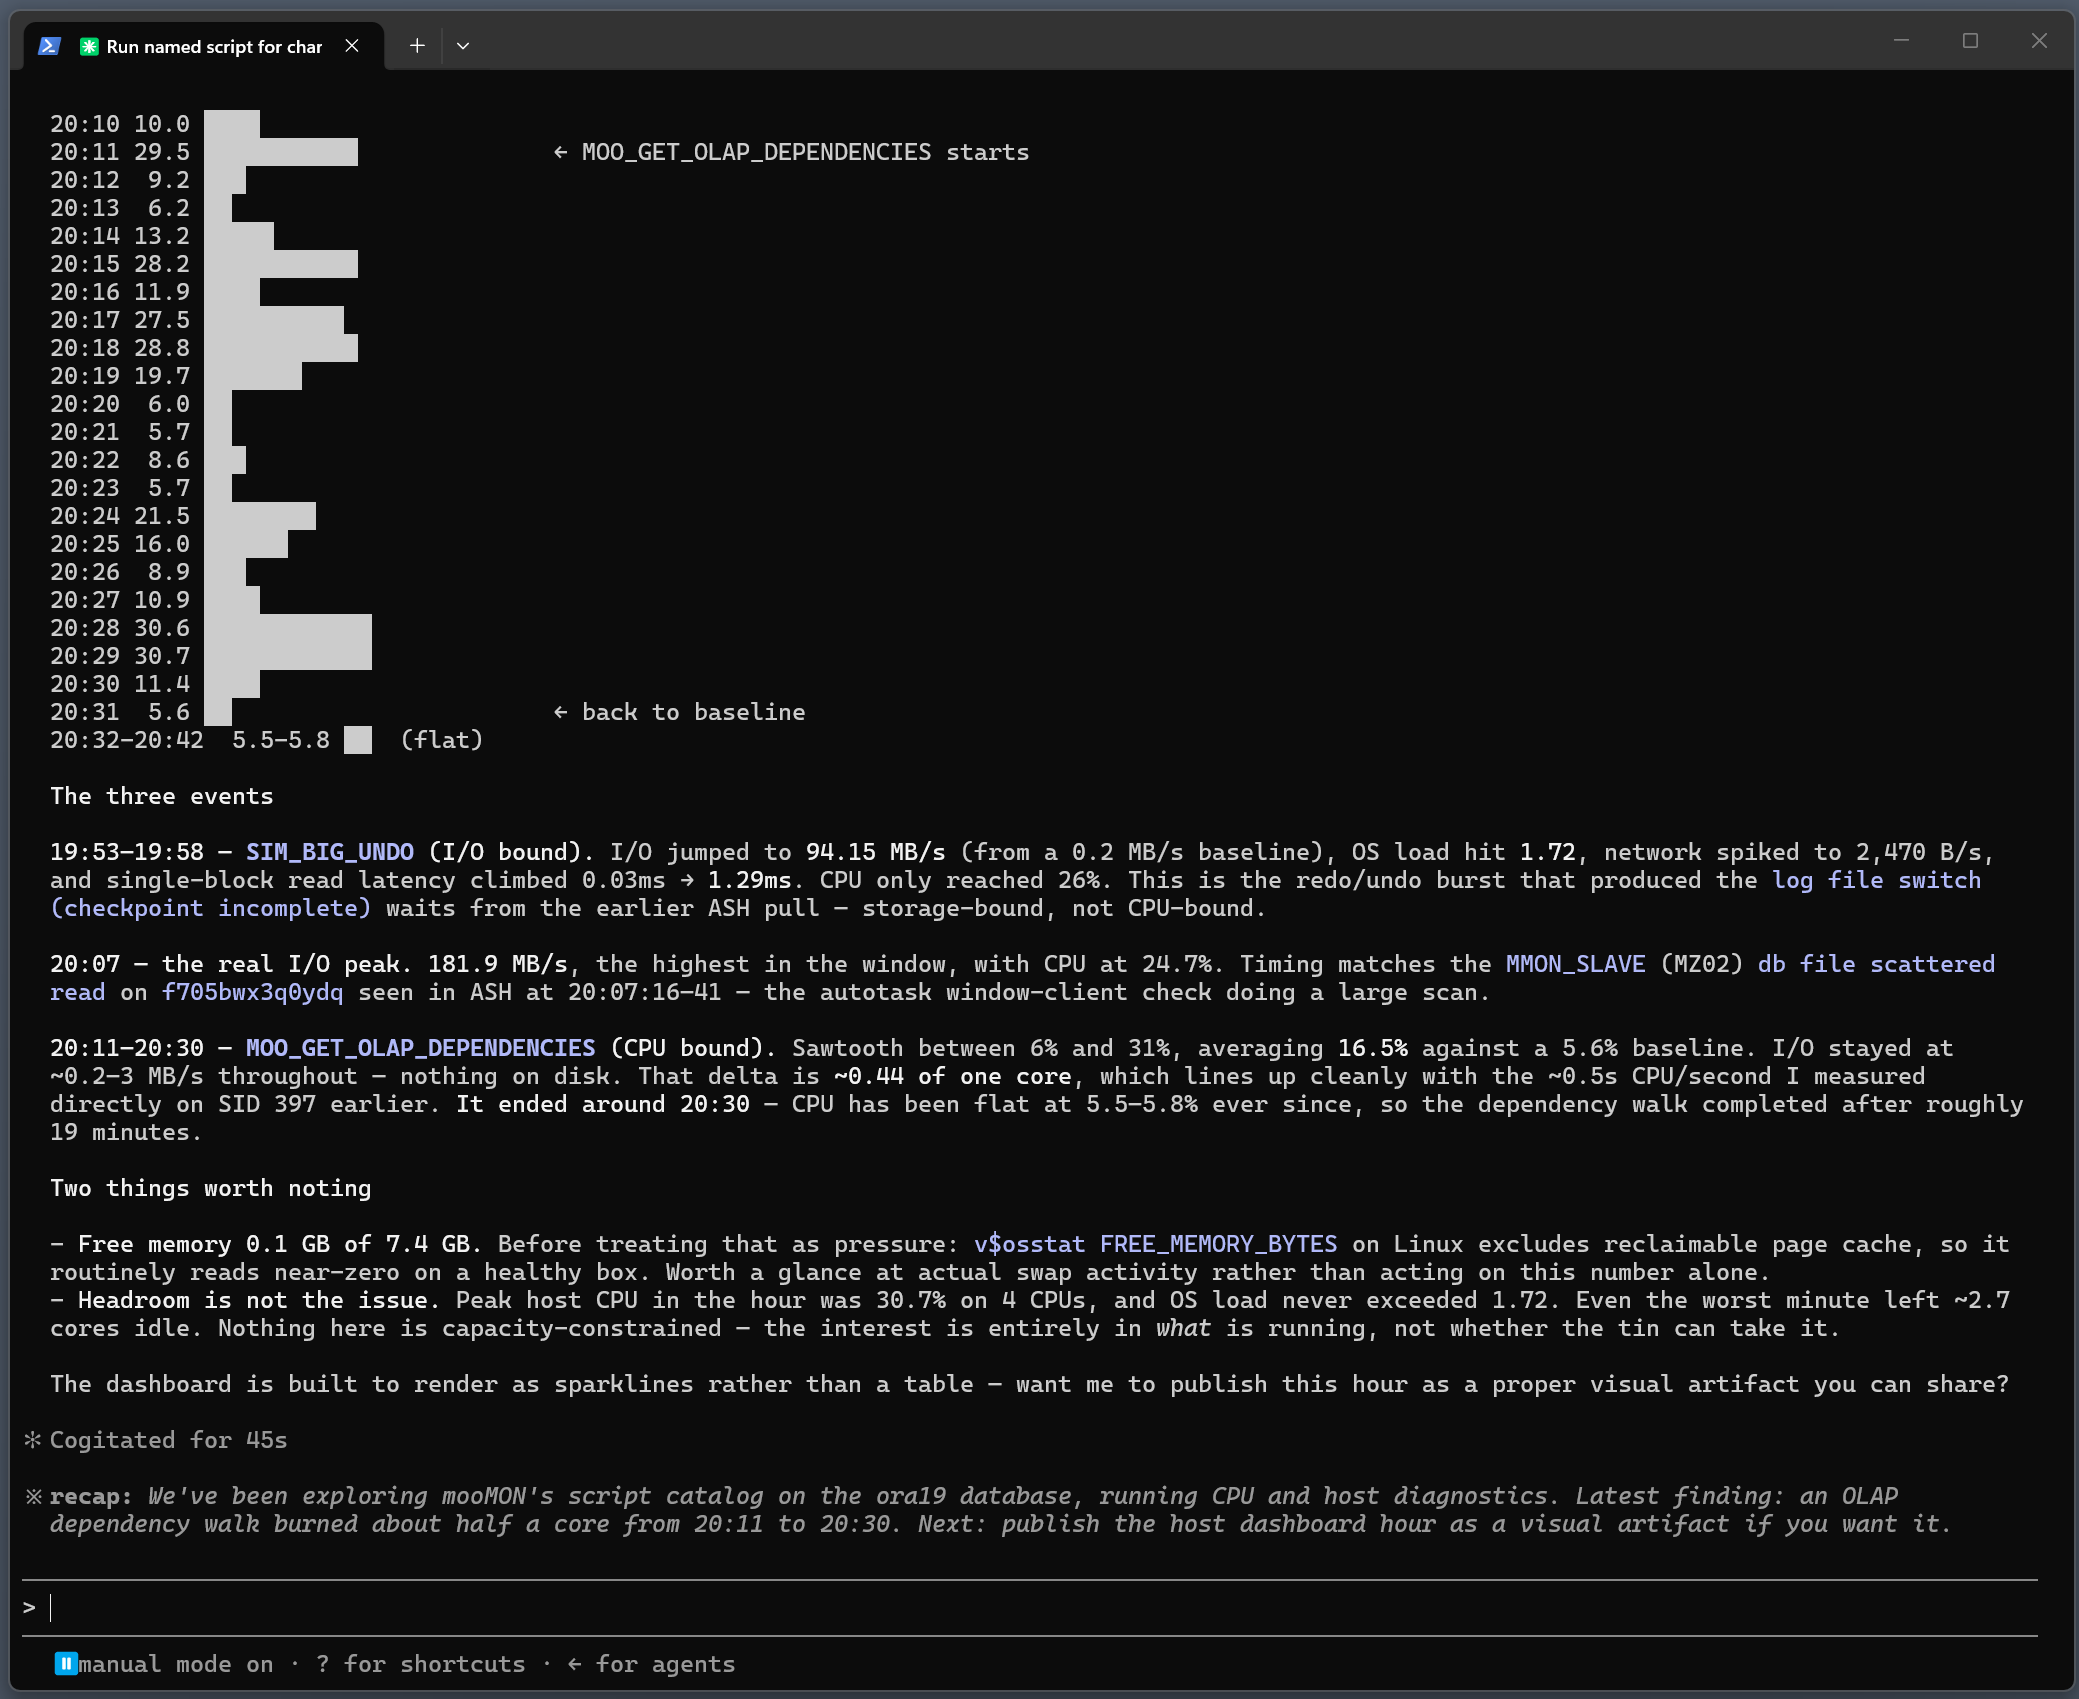
The whole surface is deliberately small and read-only — the six tools above, and nothing that writes. Every ad-hoc query is checked and must be a plain SELECT (the same sqlglot guard as the in-app assistant); anything else is refused.
The database session mooMON opens for MCP is tagged in gv$session as
mooMON, so your DBAs can always see exactly what an assistant is doing and on which
connection. And because access is per-profile and token-gated, an assistant only ever reaches the
database you pointed it at.

gv$session — visible to your
DBAs.Browsing objects
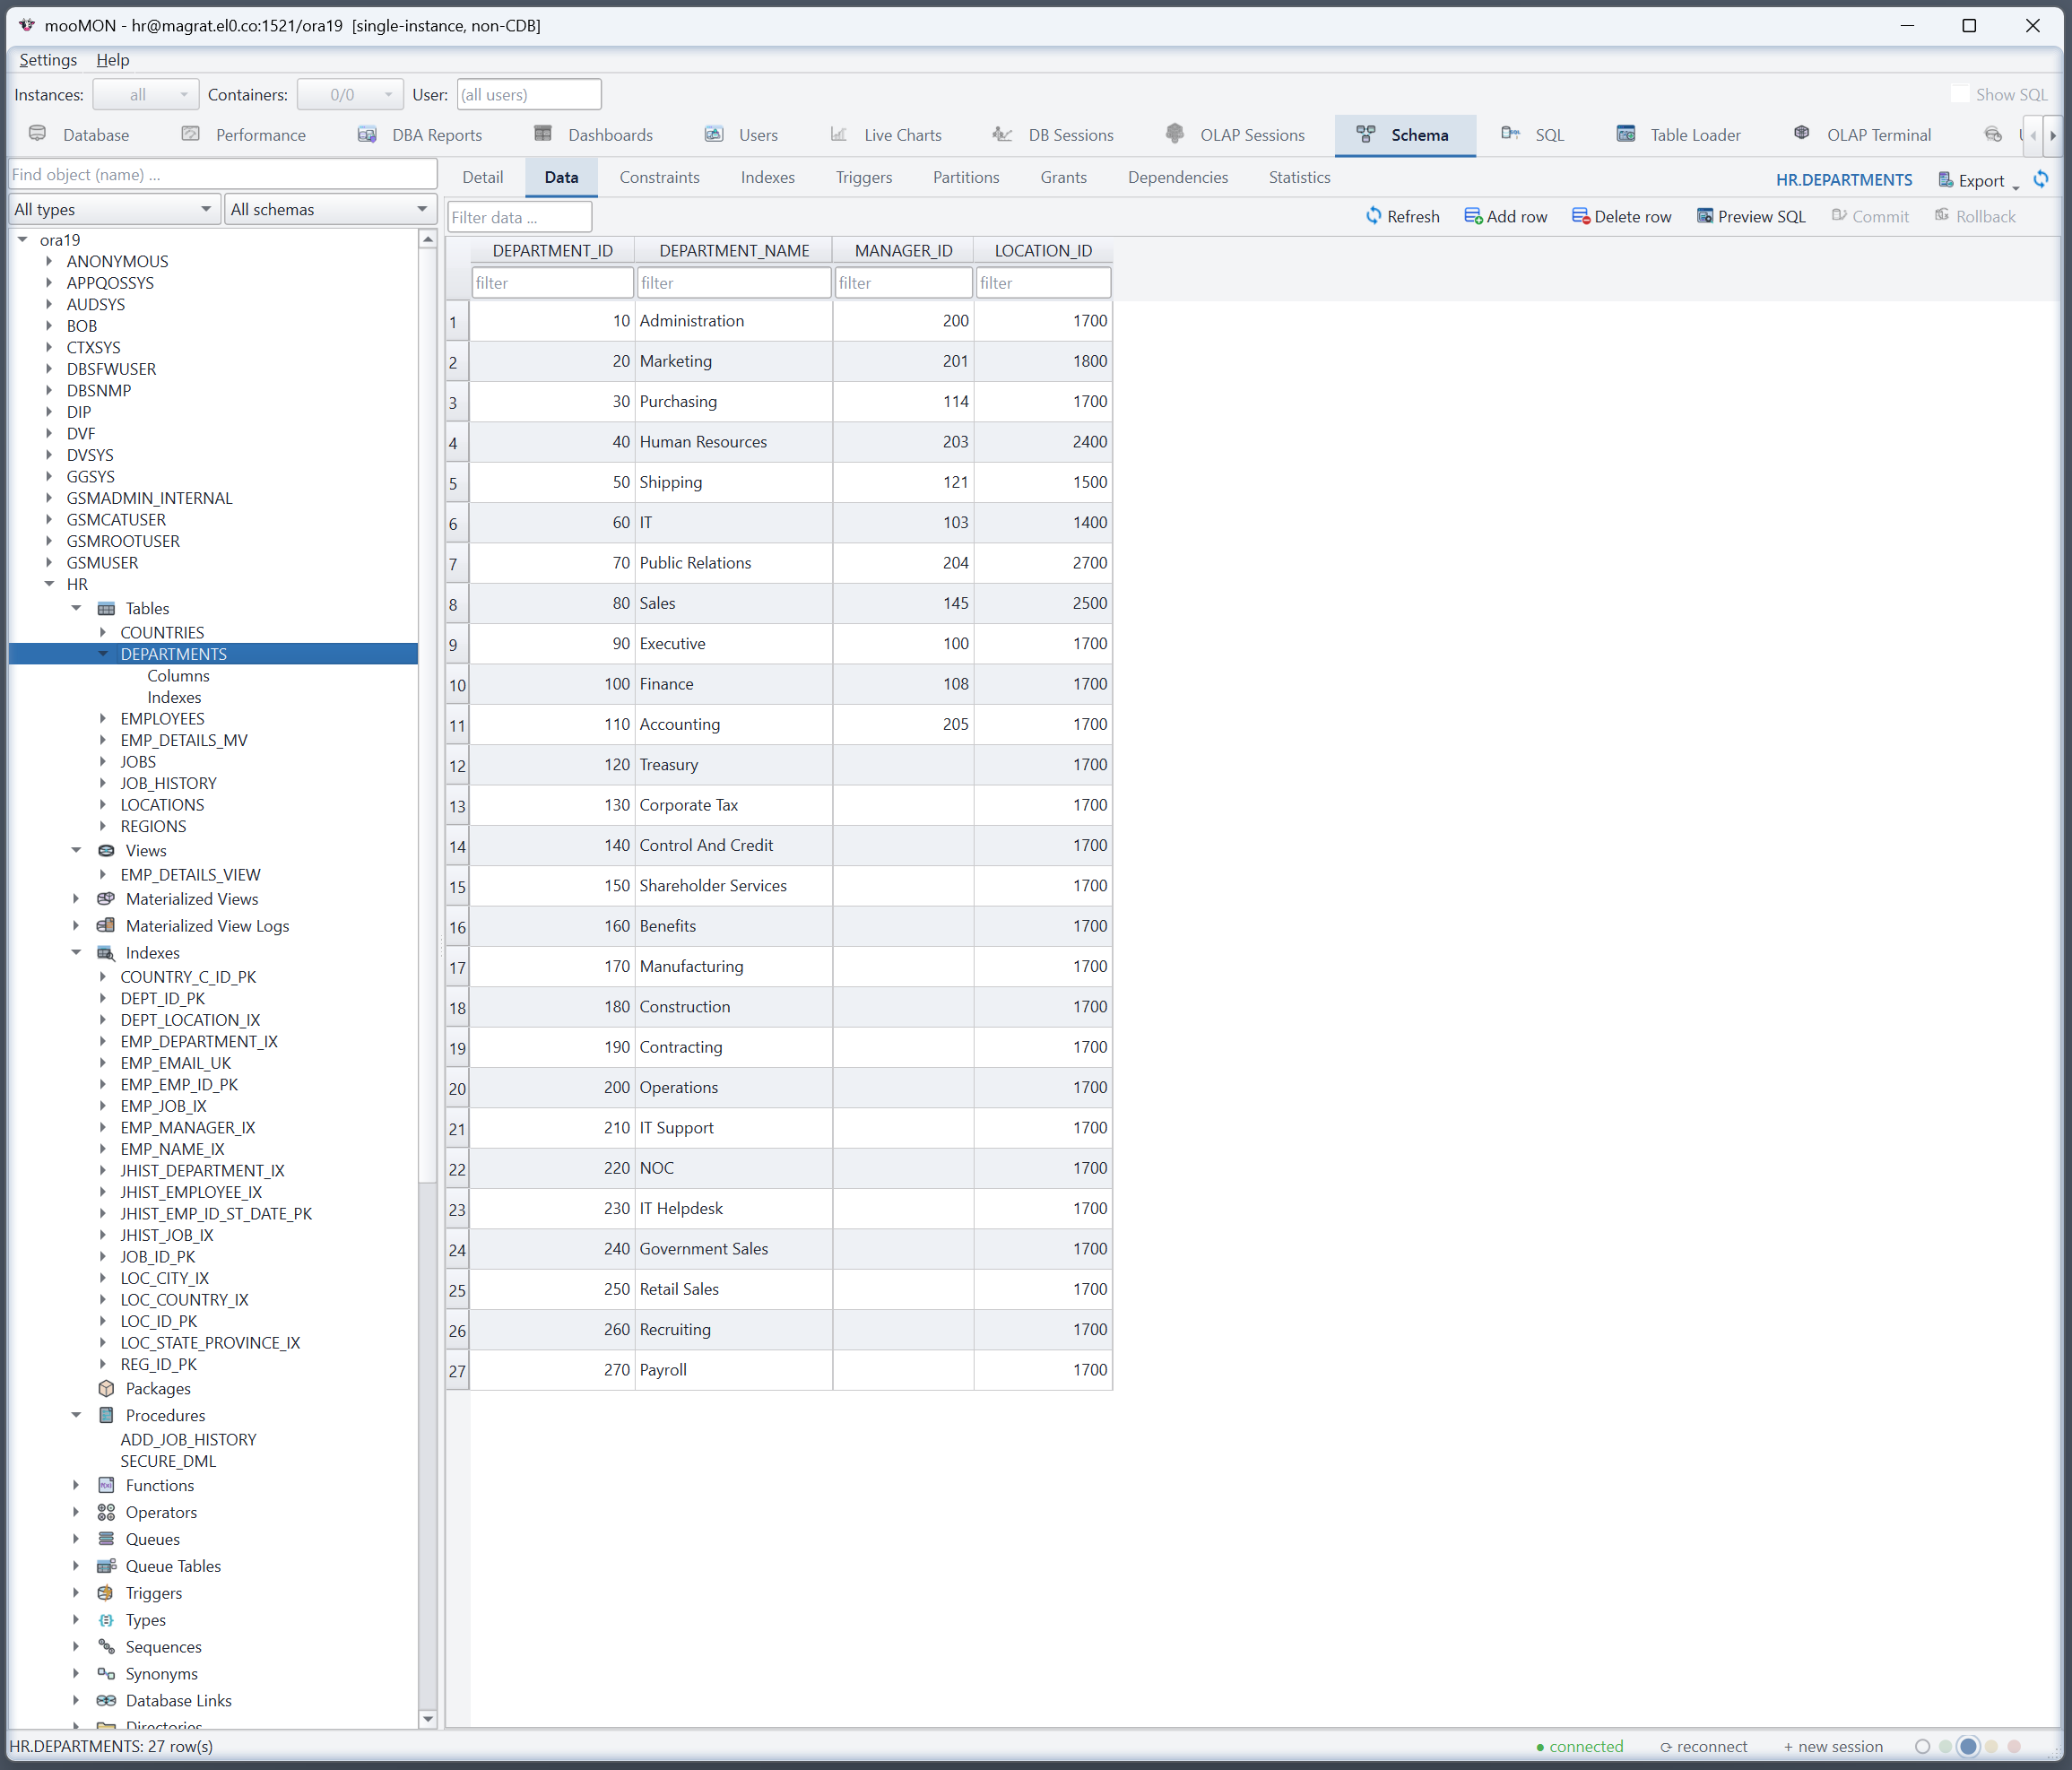
The Schema tab is a full object browser: expand a schema to see its tables, views, packages, indexes, sequences, types and more. Selecting an object shows its detail, and the tabs across the top give you its columns, constraints, indexes, triggers, partitions, grants, dependencies, statistics and data.
Editing data — safely
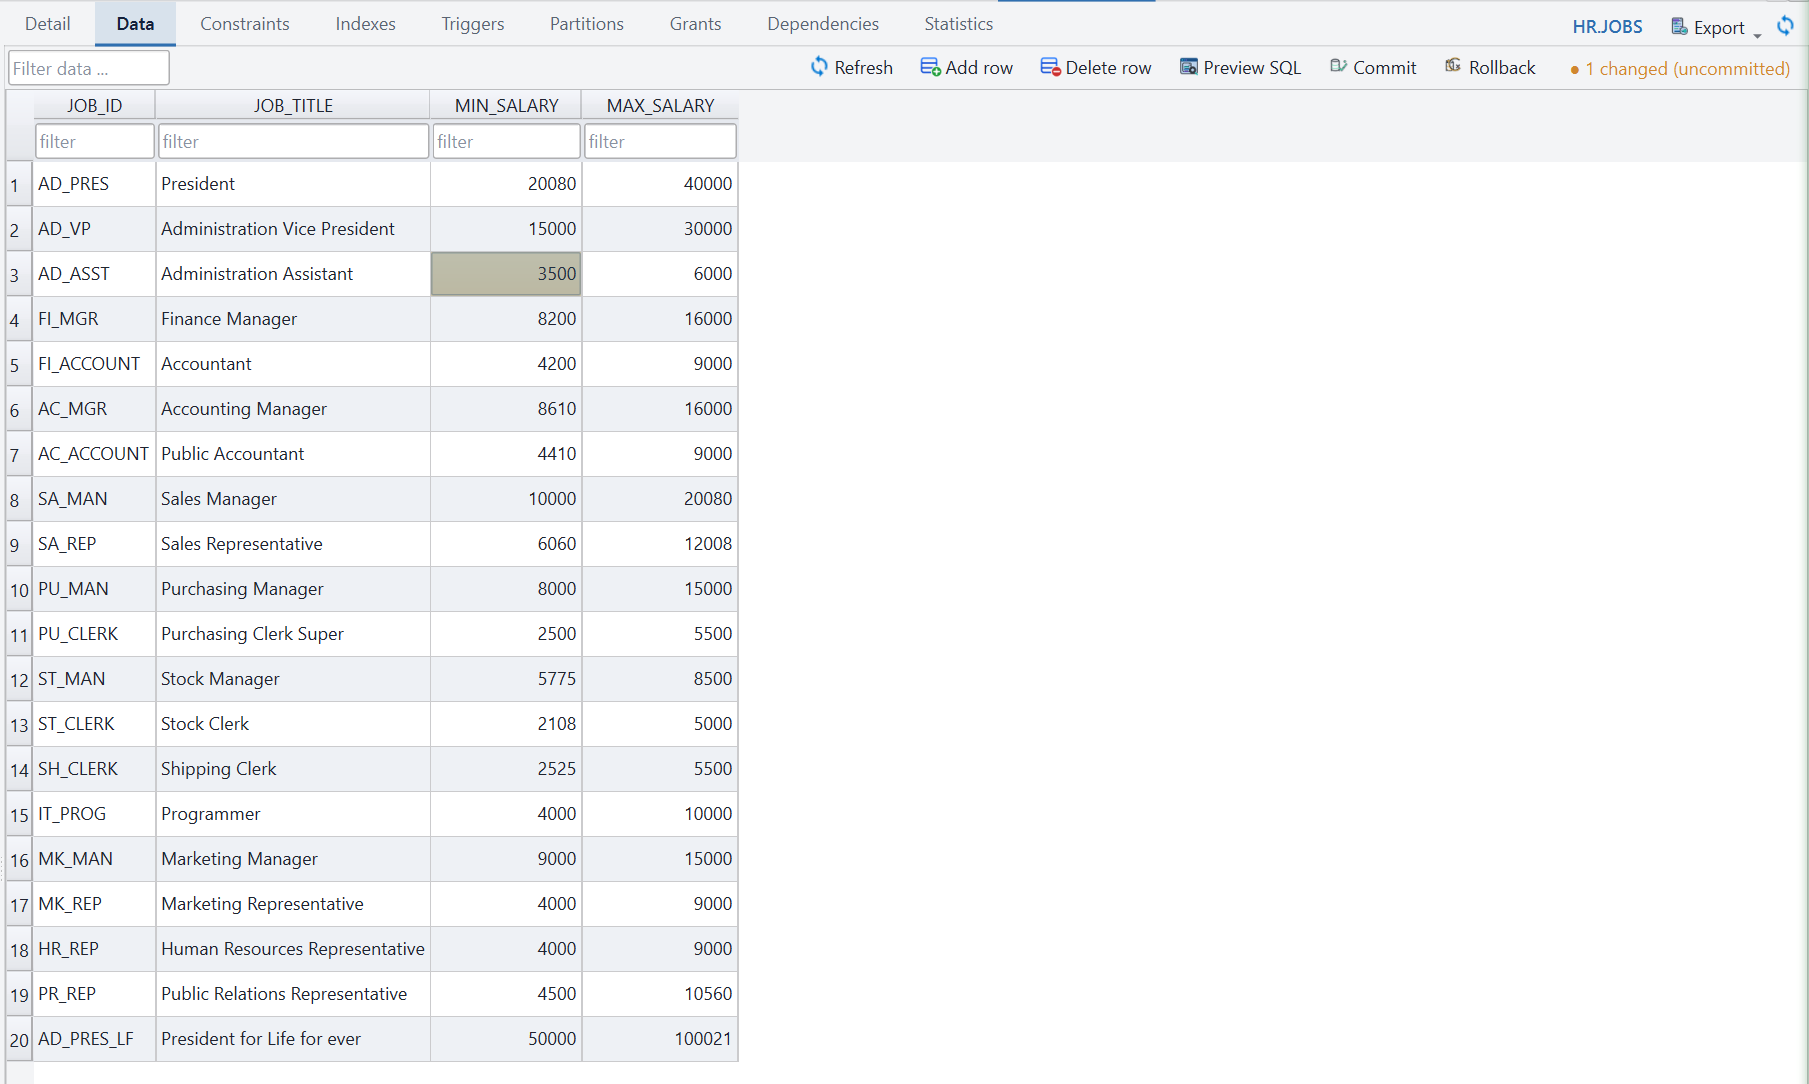
On the Data tab of a table you can edit rows directly in the grid. Changes are staged, not applied — an amber indicator counts what's new, changed or to be deleted. Preview SQL shows the exact statements first; Commit applies them as one transaction, and Rollback discards them.
DDL, keys & columns
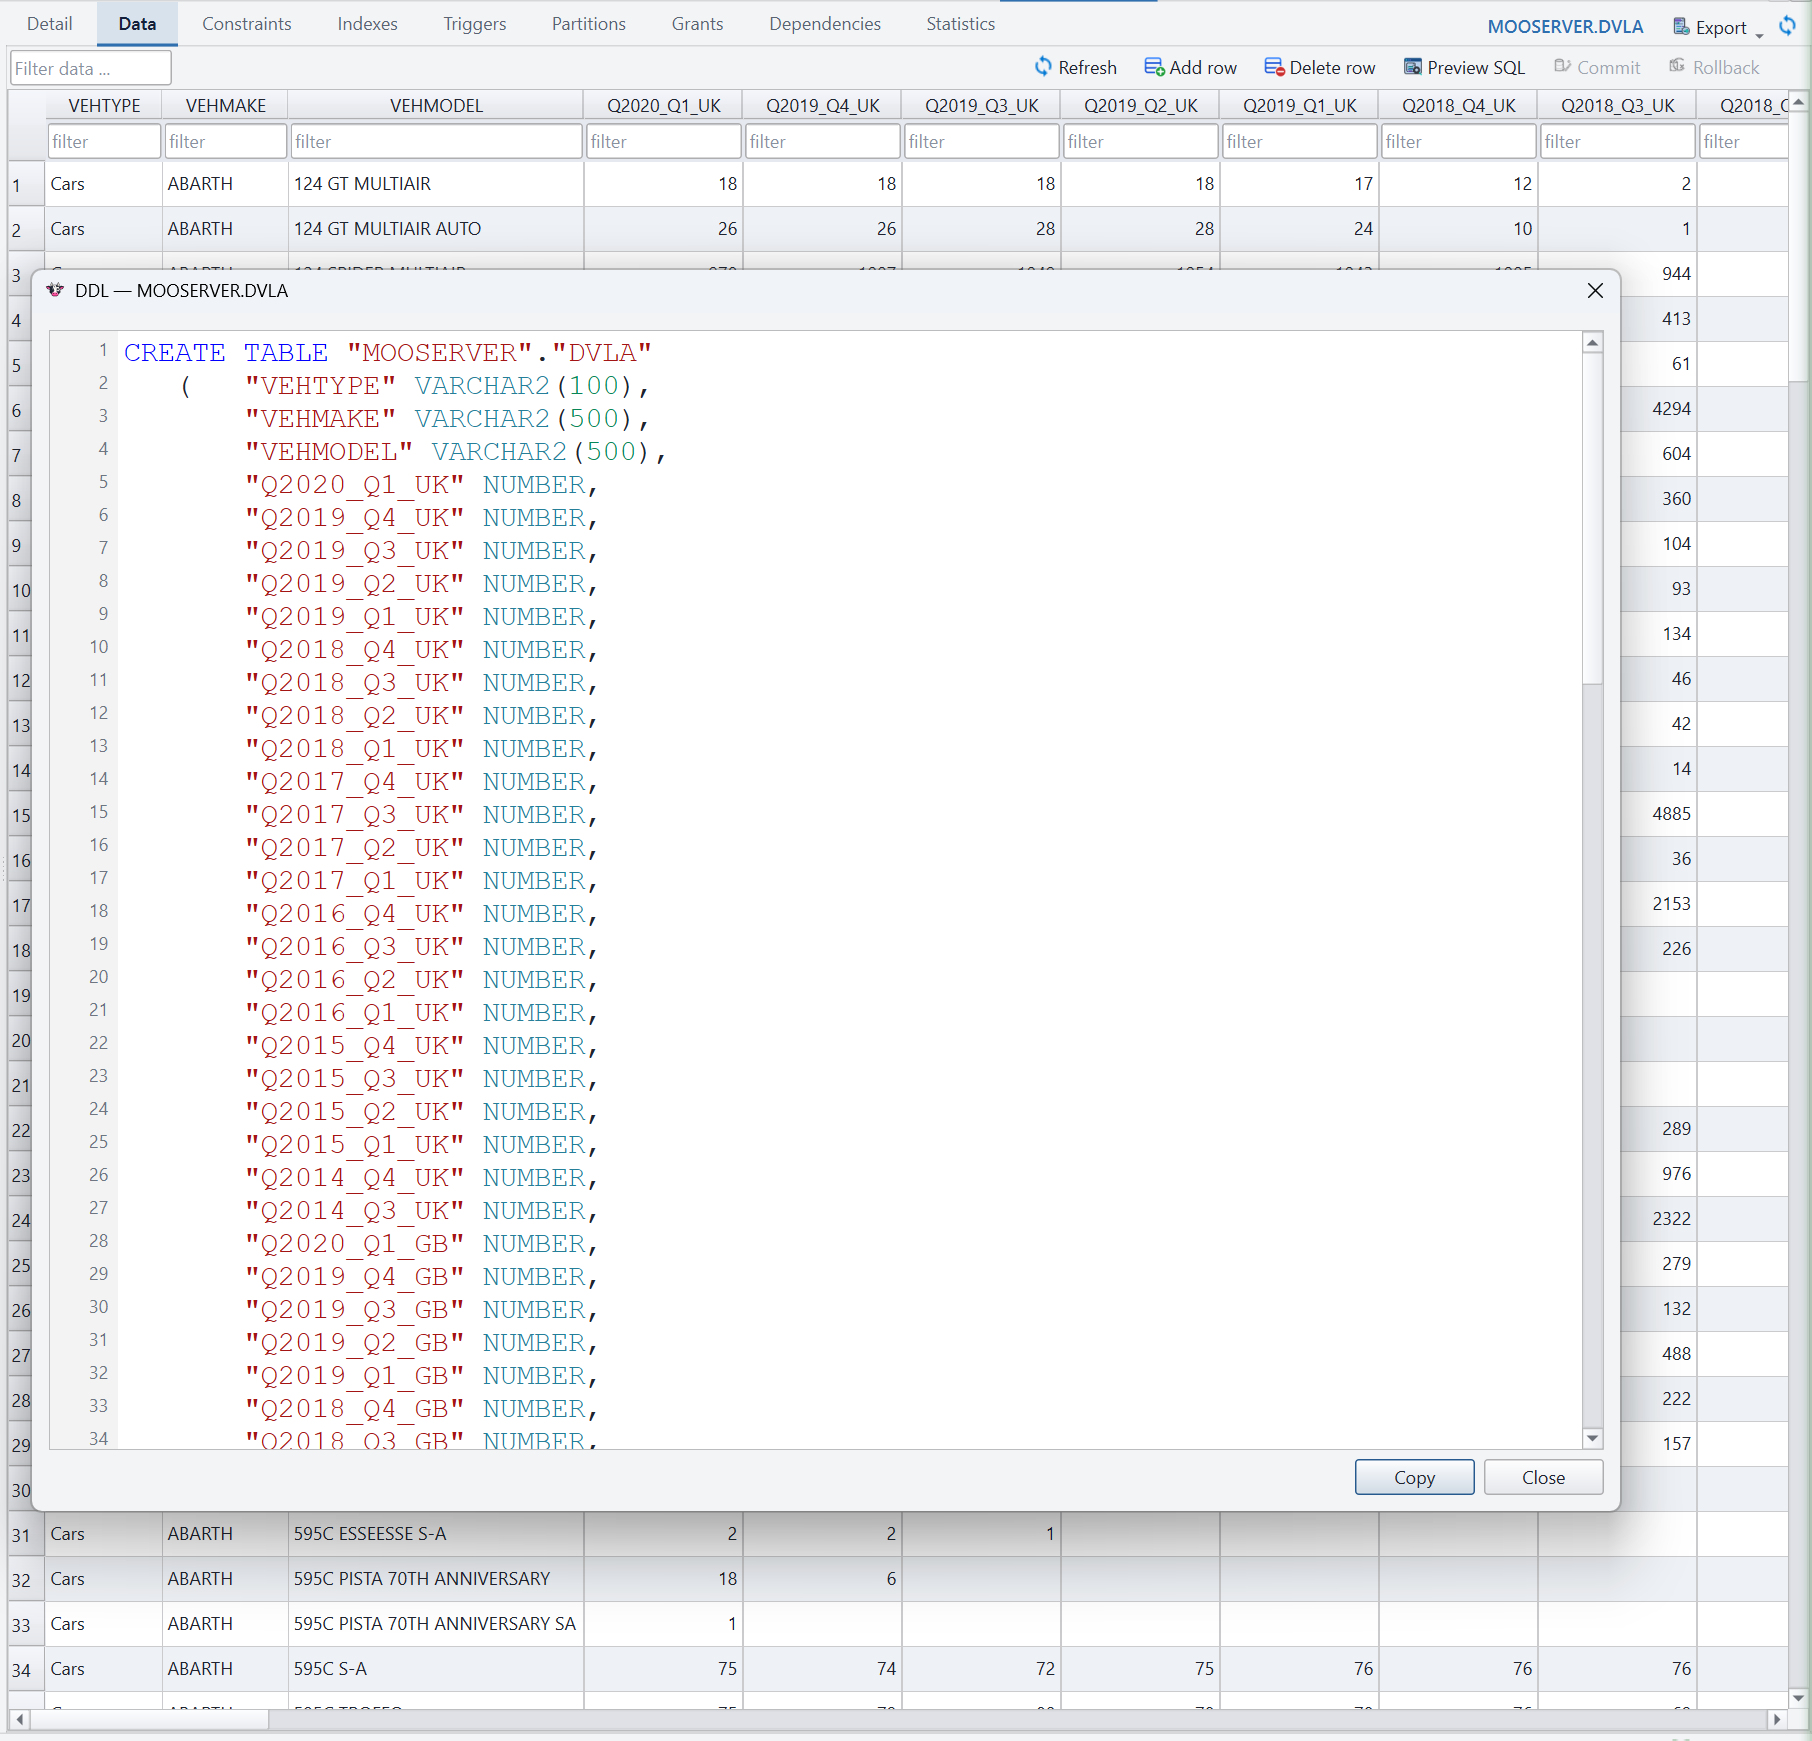
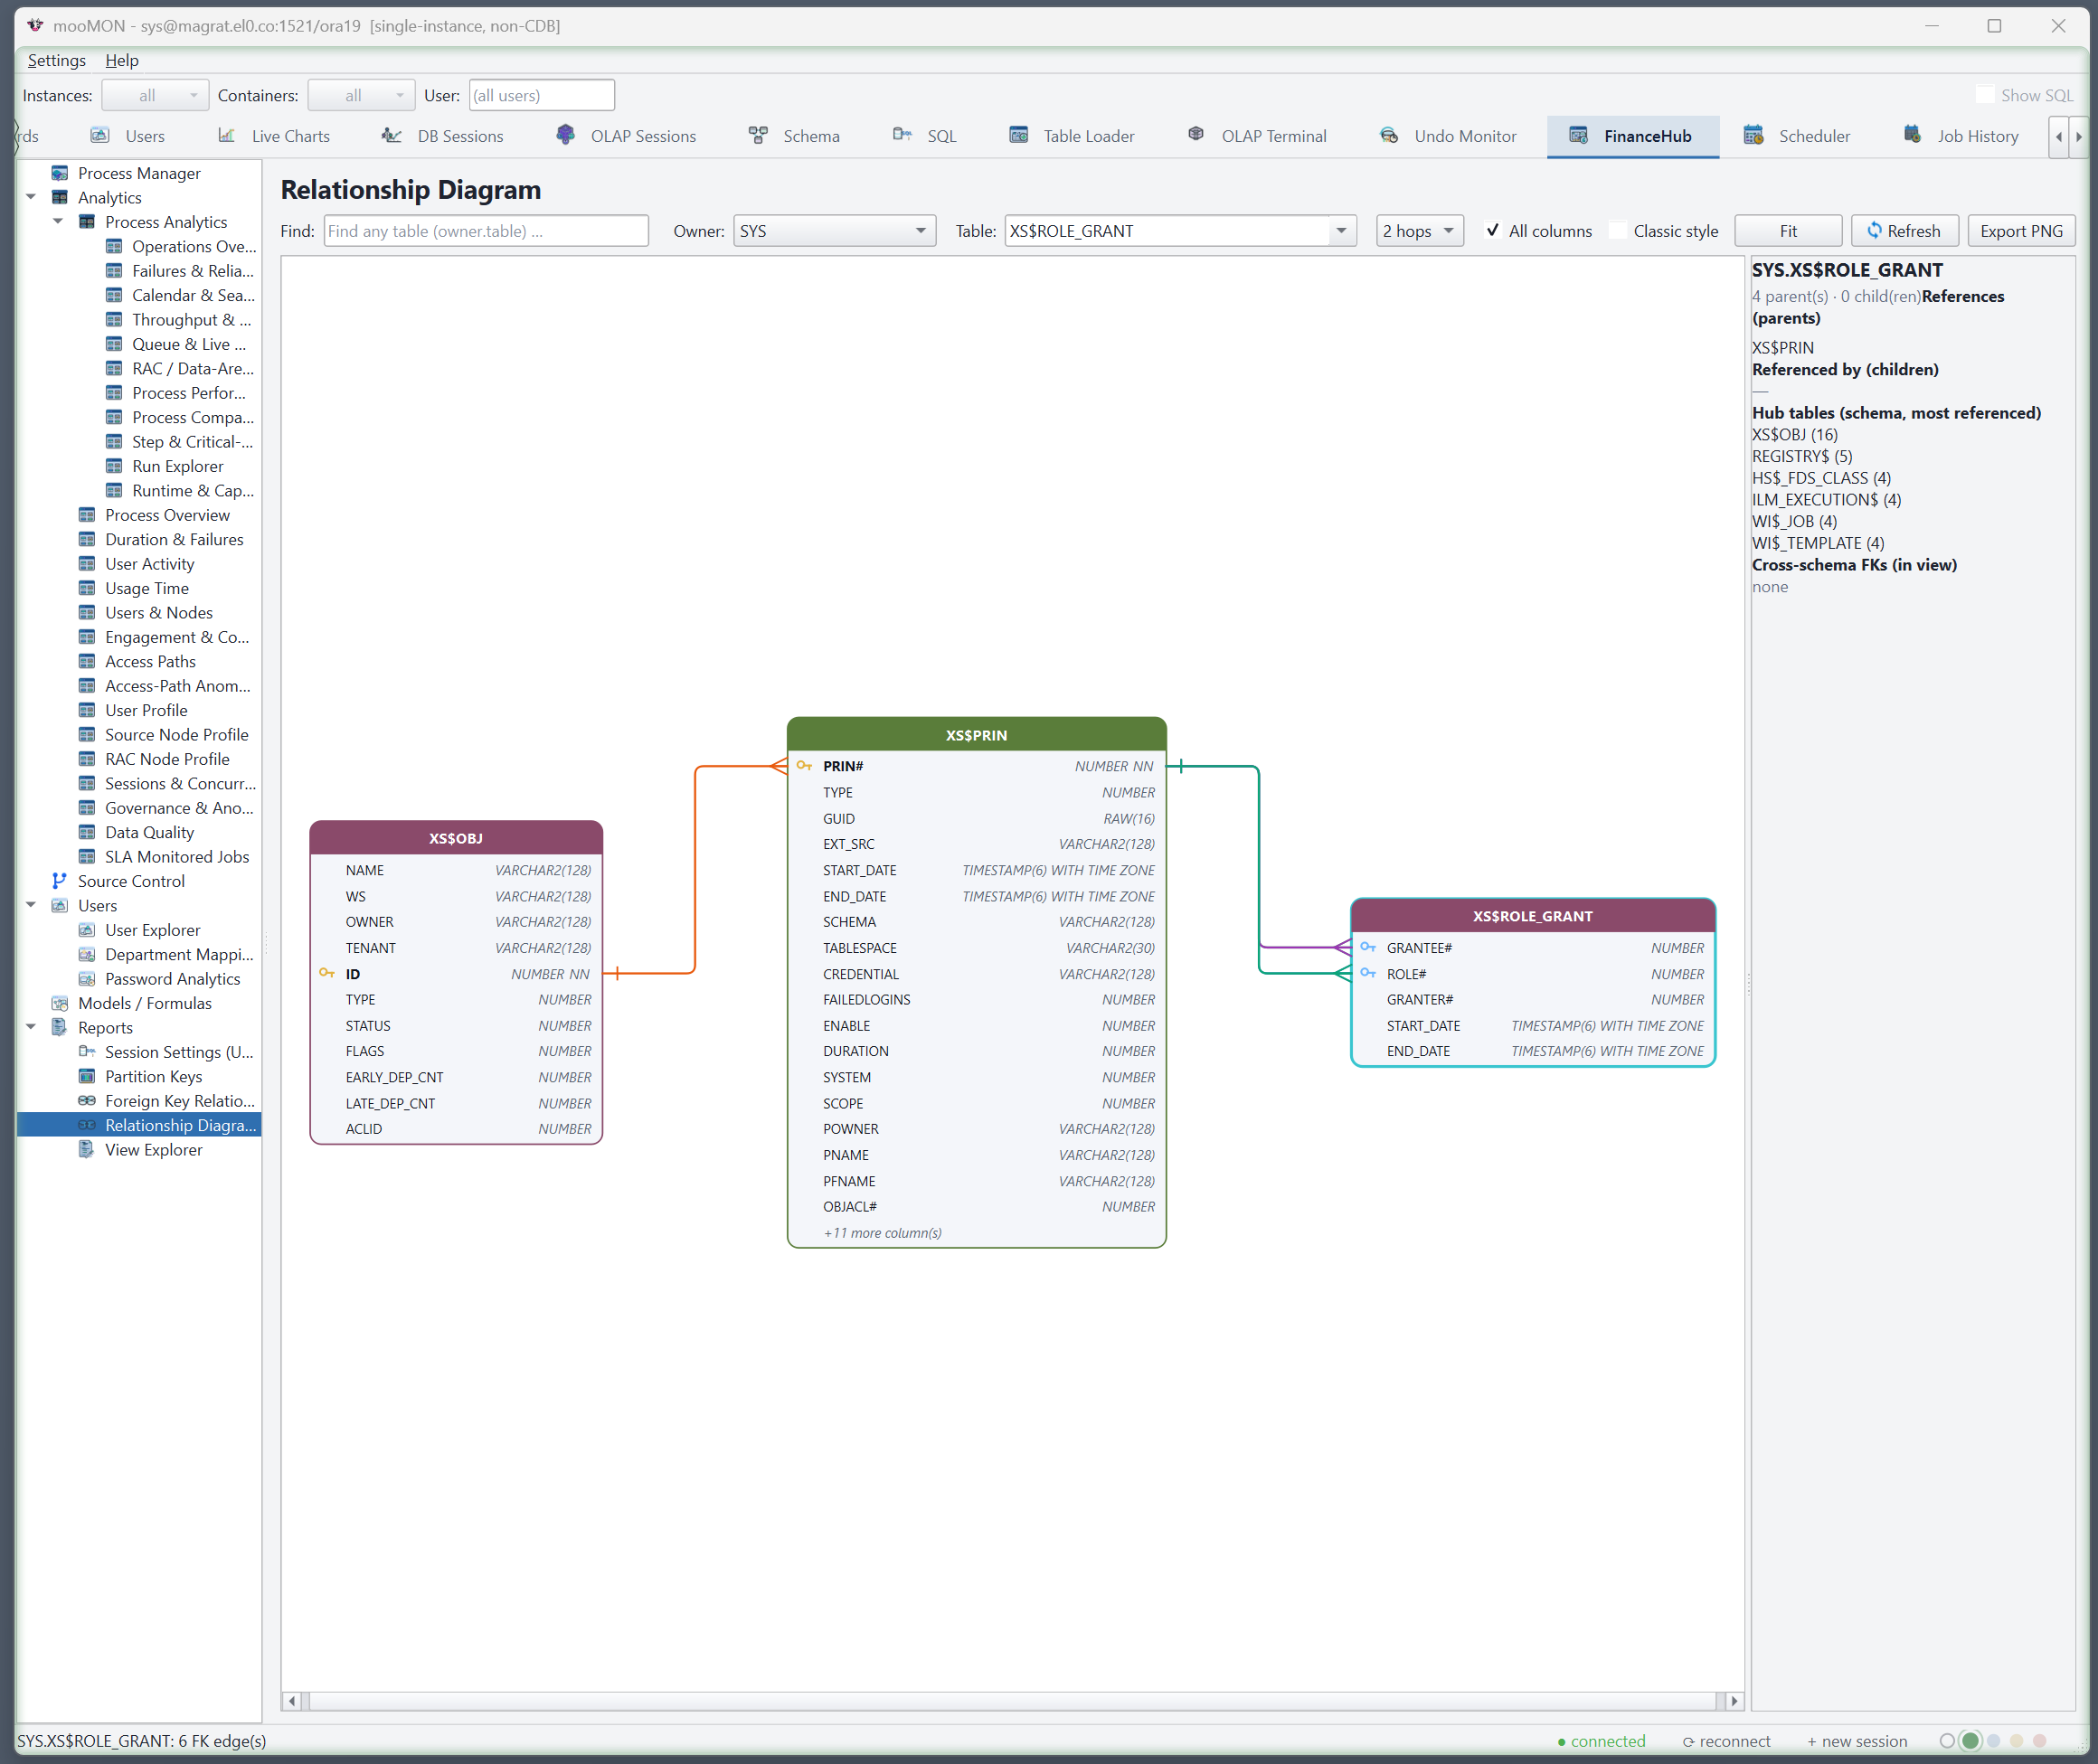
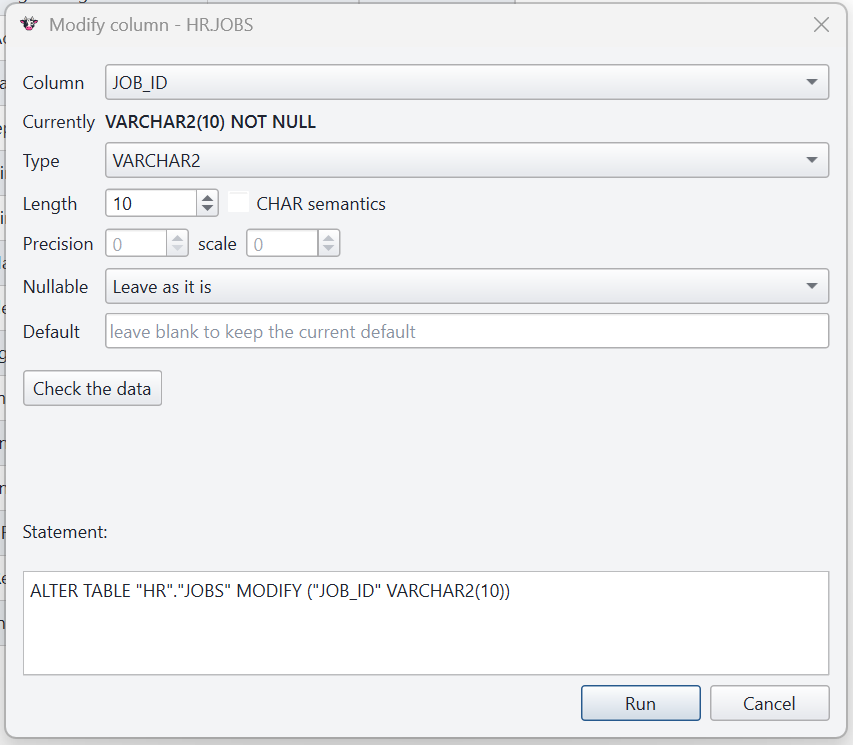
Read an object's DDL straight from the browser, visualise its foreign-key relationships as a diagram, and alter a column with a guided dialog that builds the SQL and checks for the obvious hazards before you run it.
PL/SQL editor
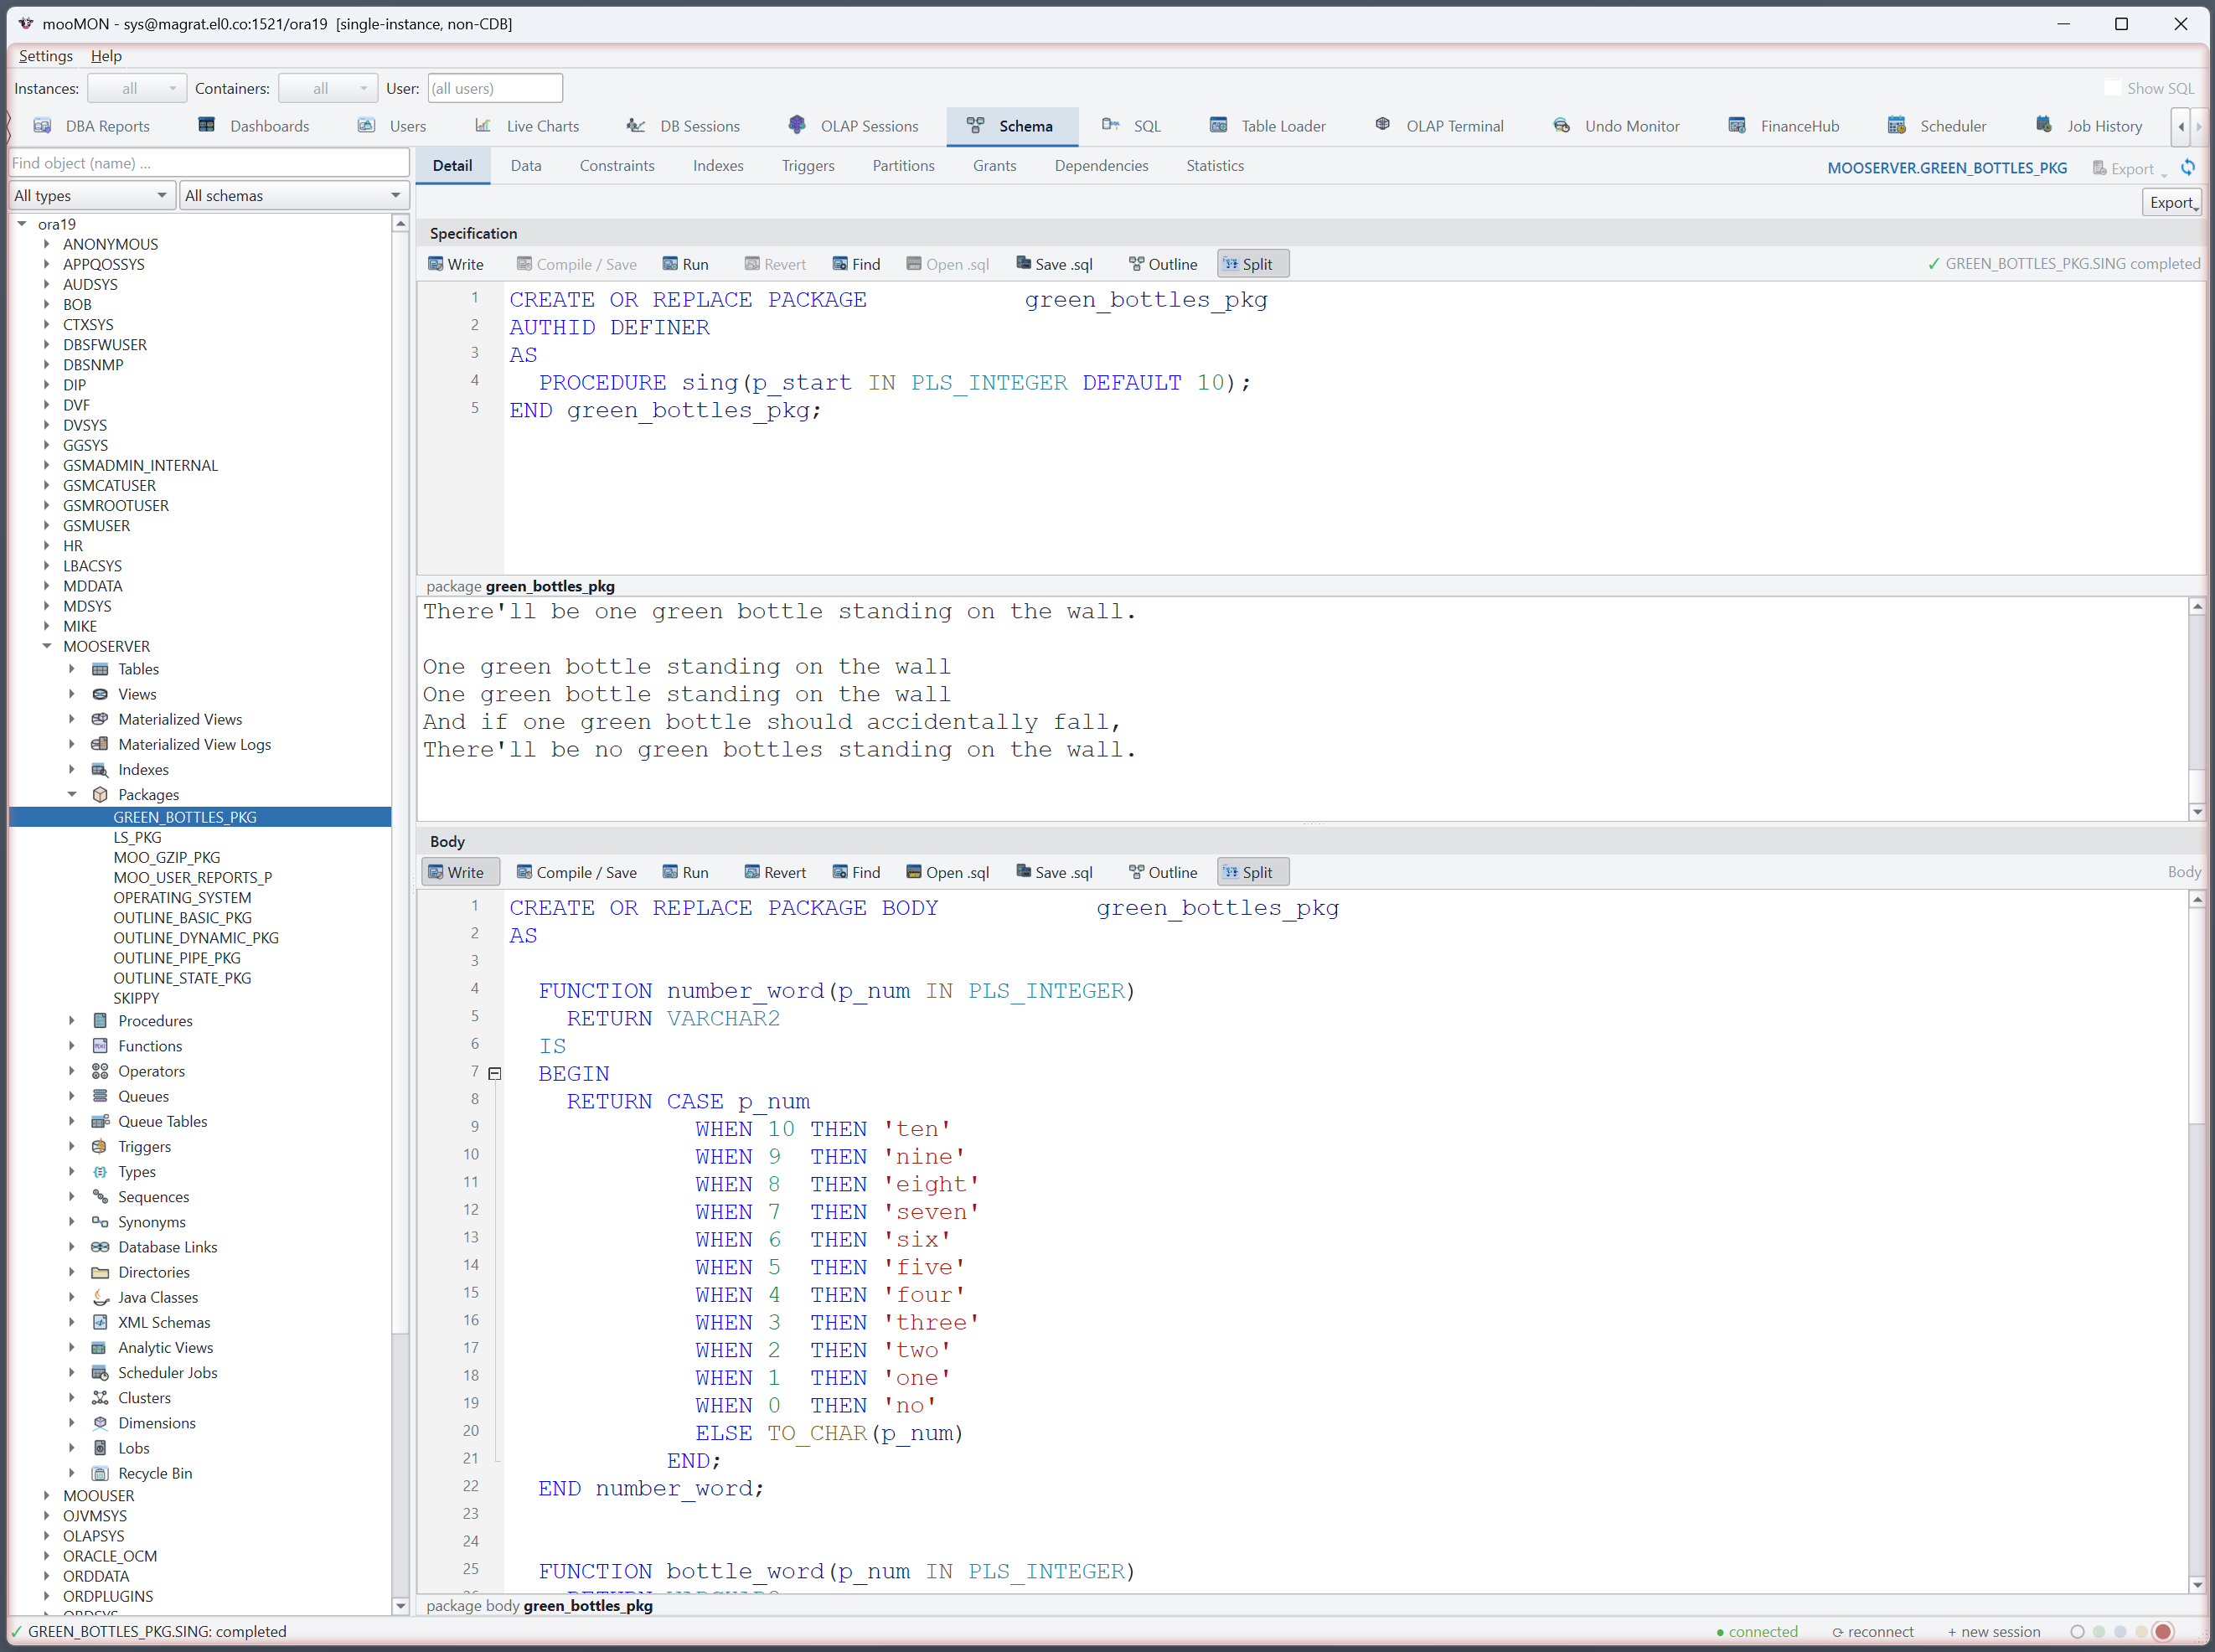
Open a package, procedure or function in a full pop-out editor with syntax highlighting, an outline for jumping around large bodies, Find/Replace, and a split view so you can see a package's specification and body together. Compile and run right from the toolbar — mooMON collects any argument values first — and export the source or the page.
Object details
Selecting a table, view or other object fills a row of detail tabs: Detail (columns and types), Data, Constraints, Indexes, Triggers, Partitions, Grants, Dependencies and Statistics. Only the tabs that apply to the object type appear.
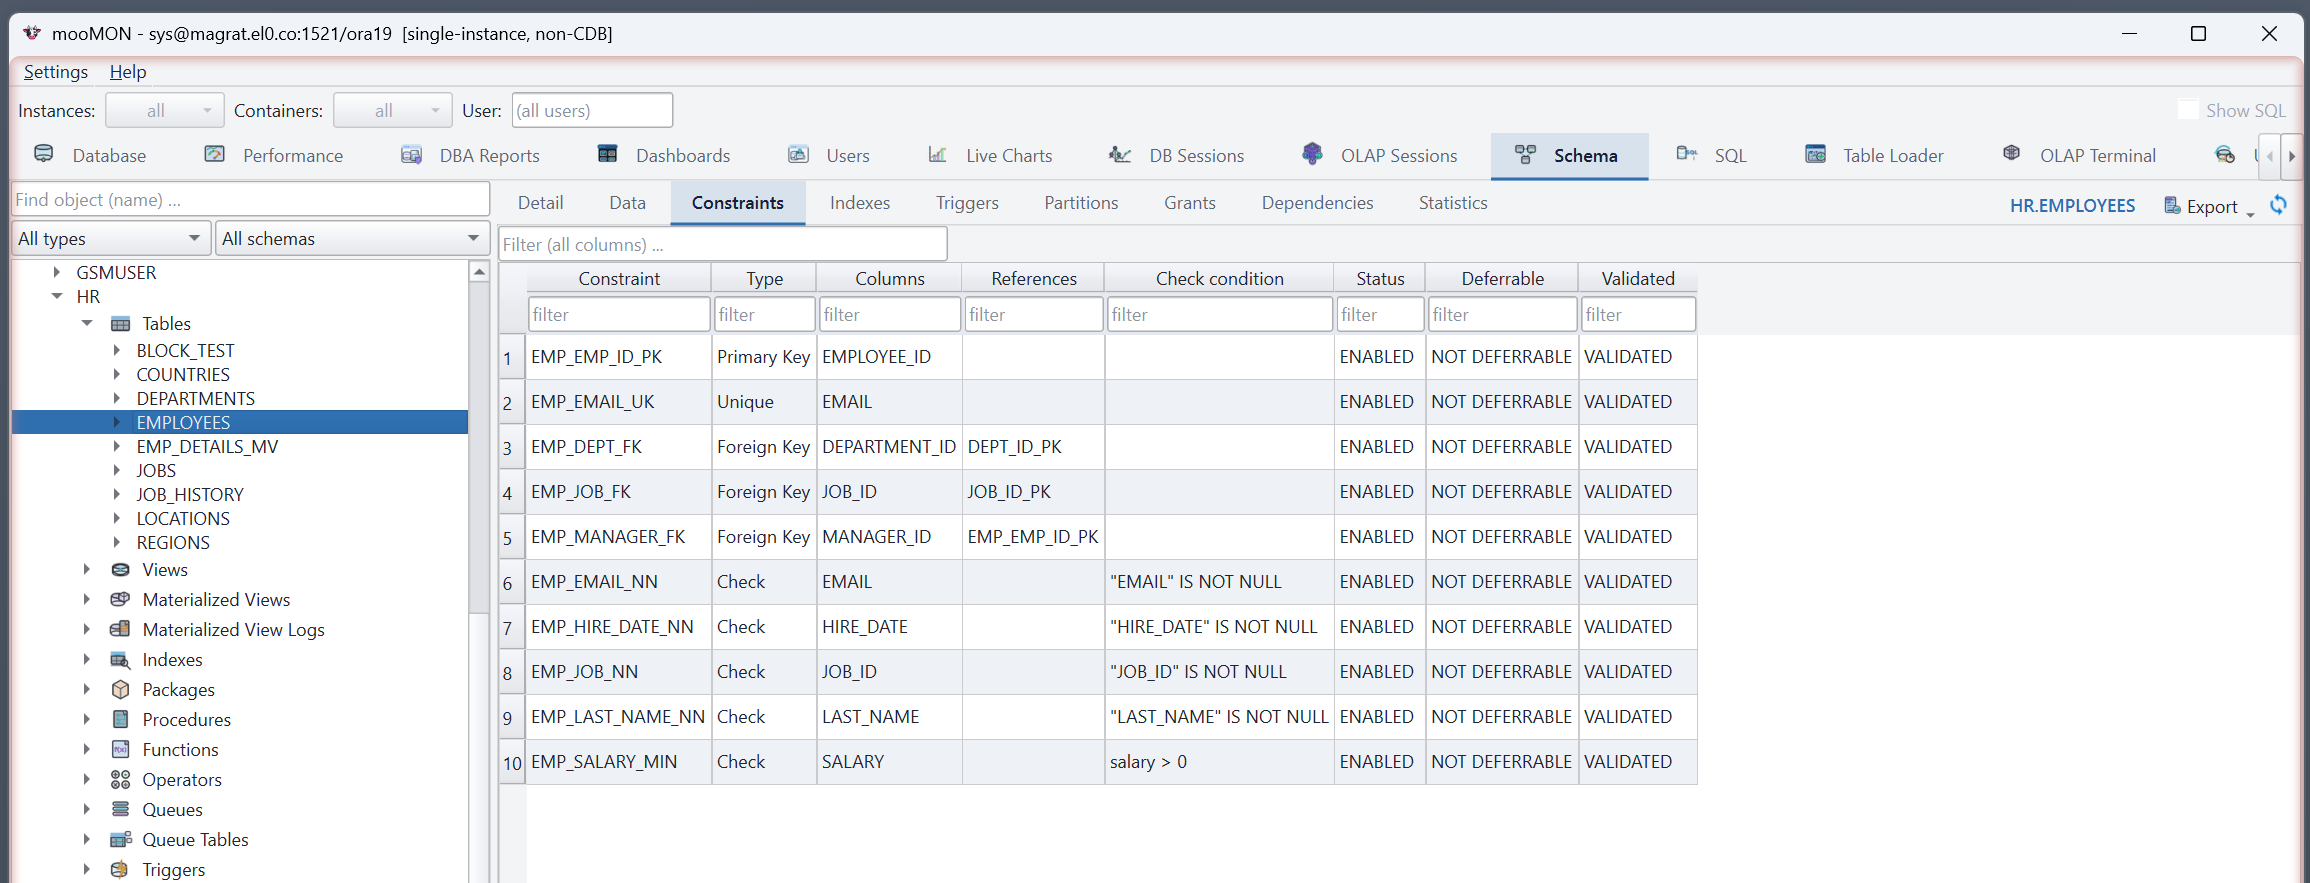
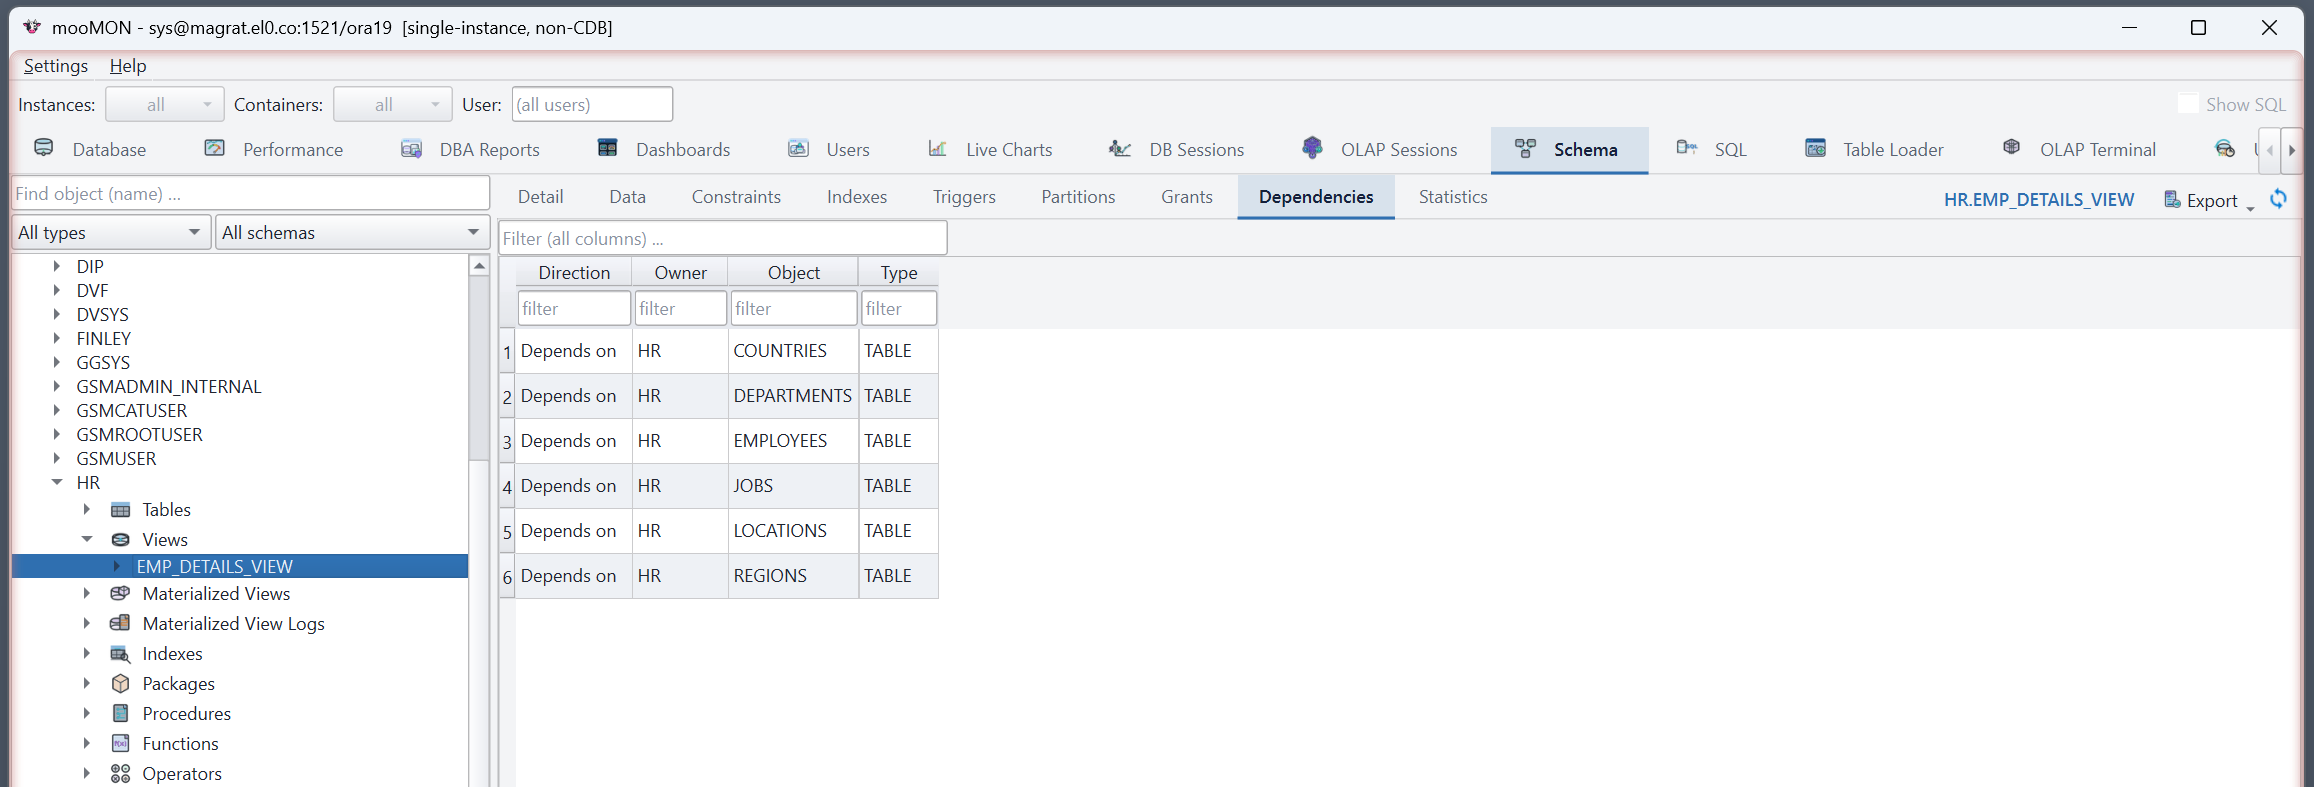
Table Loader
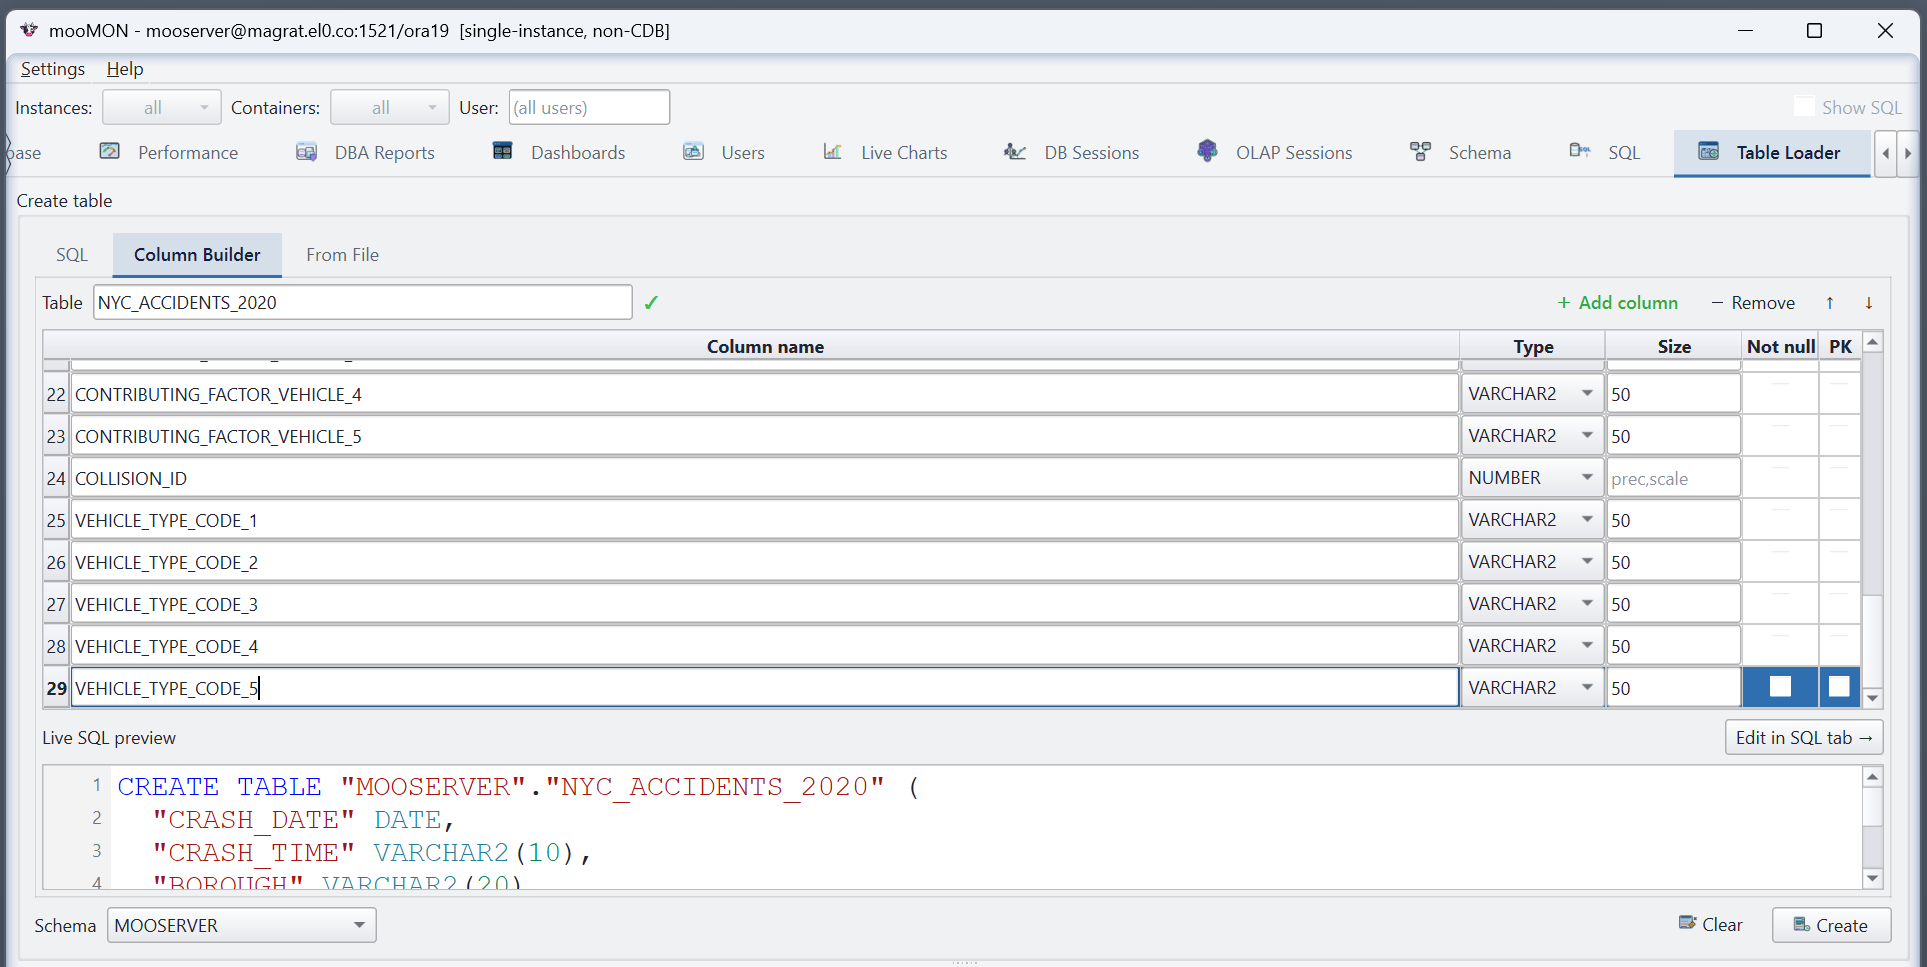
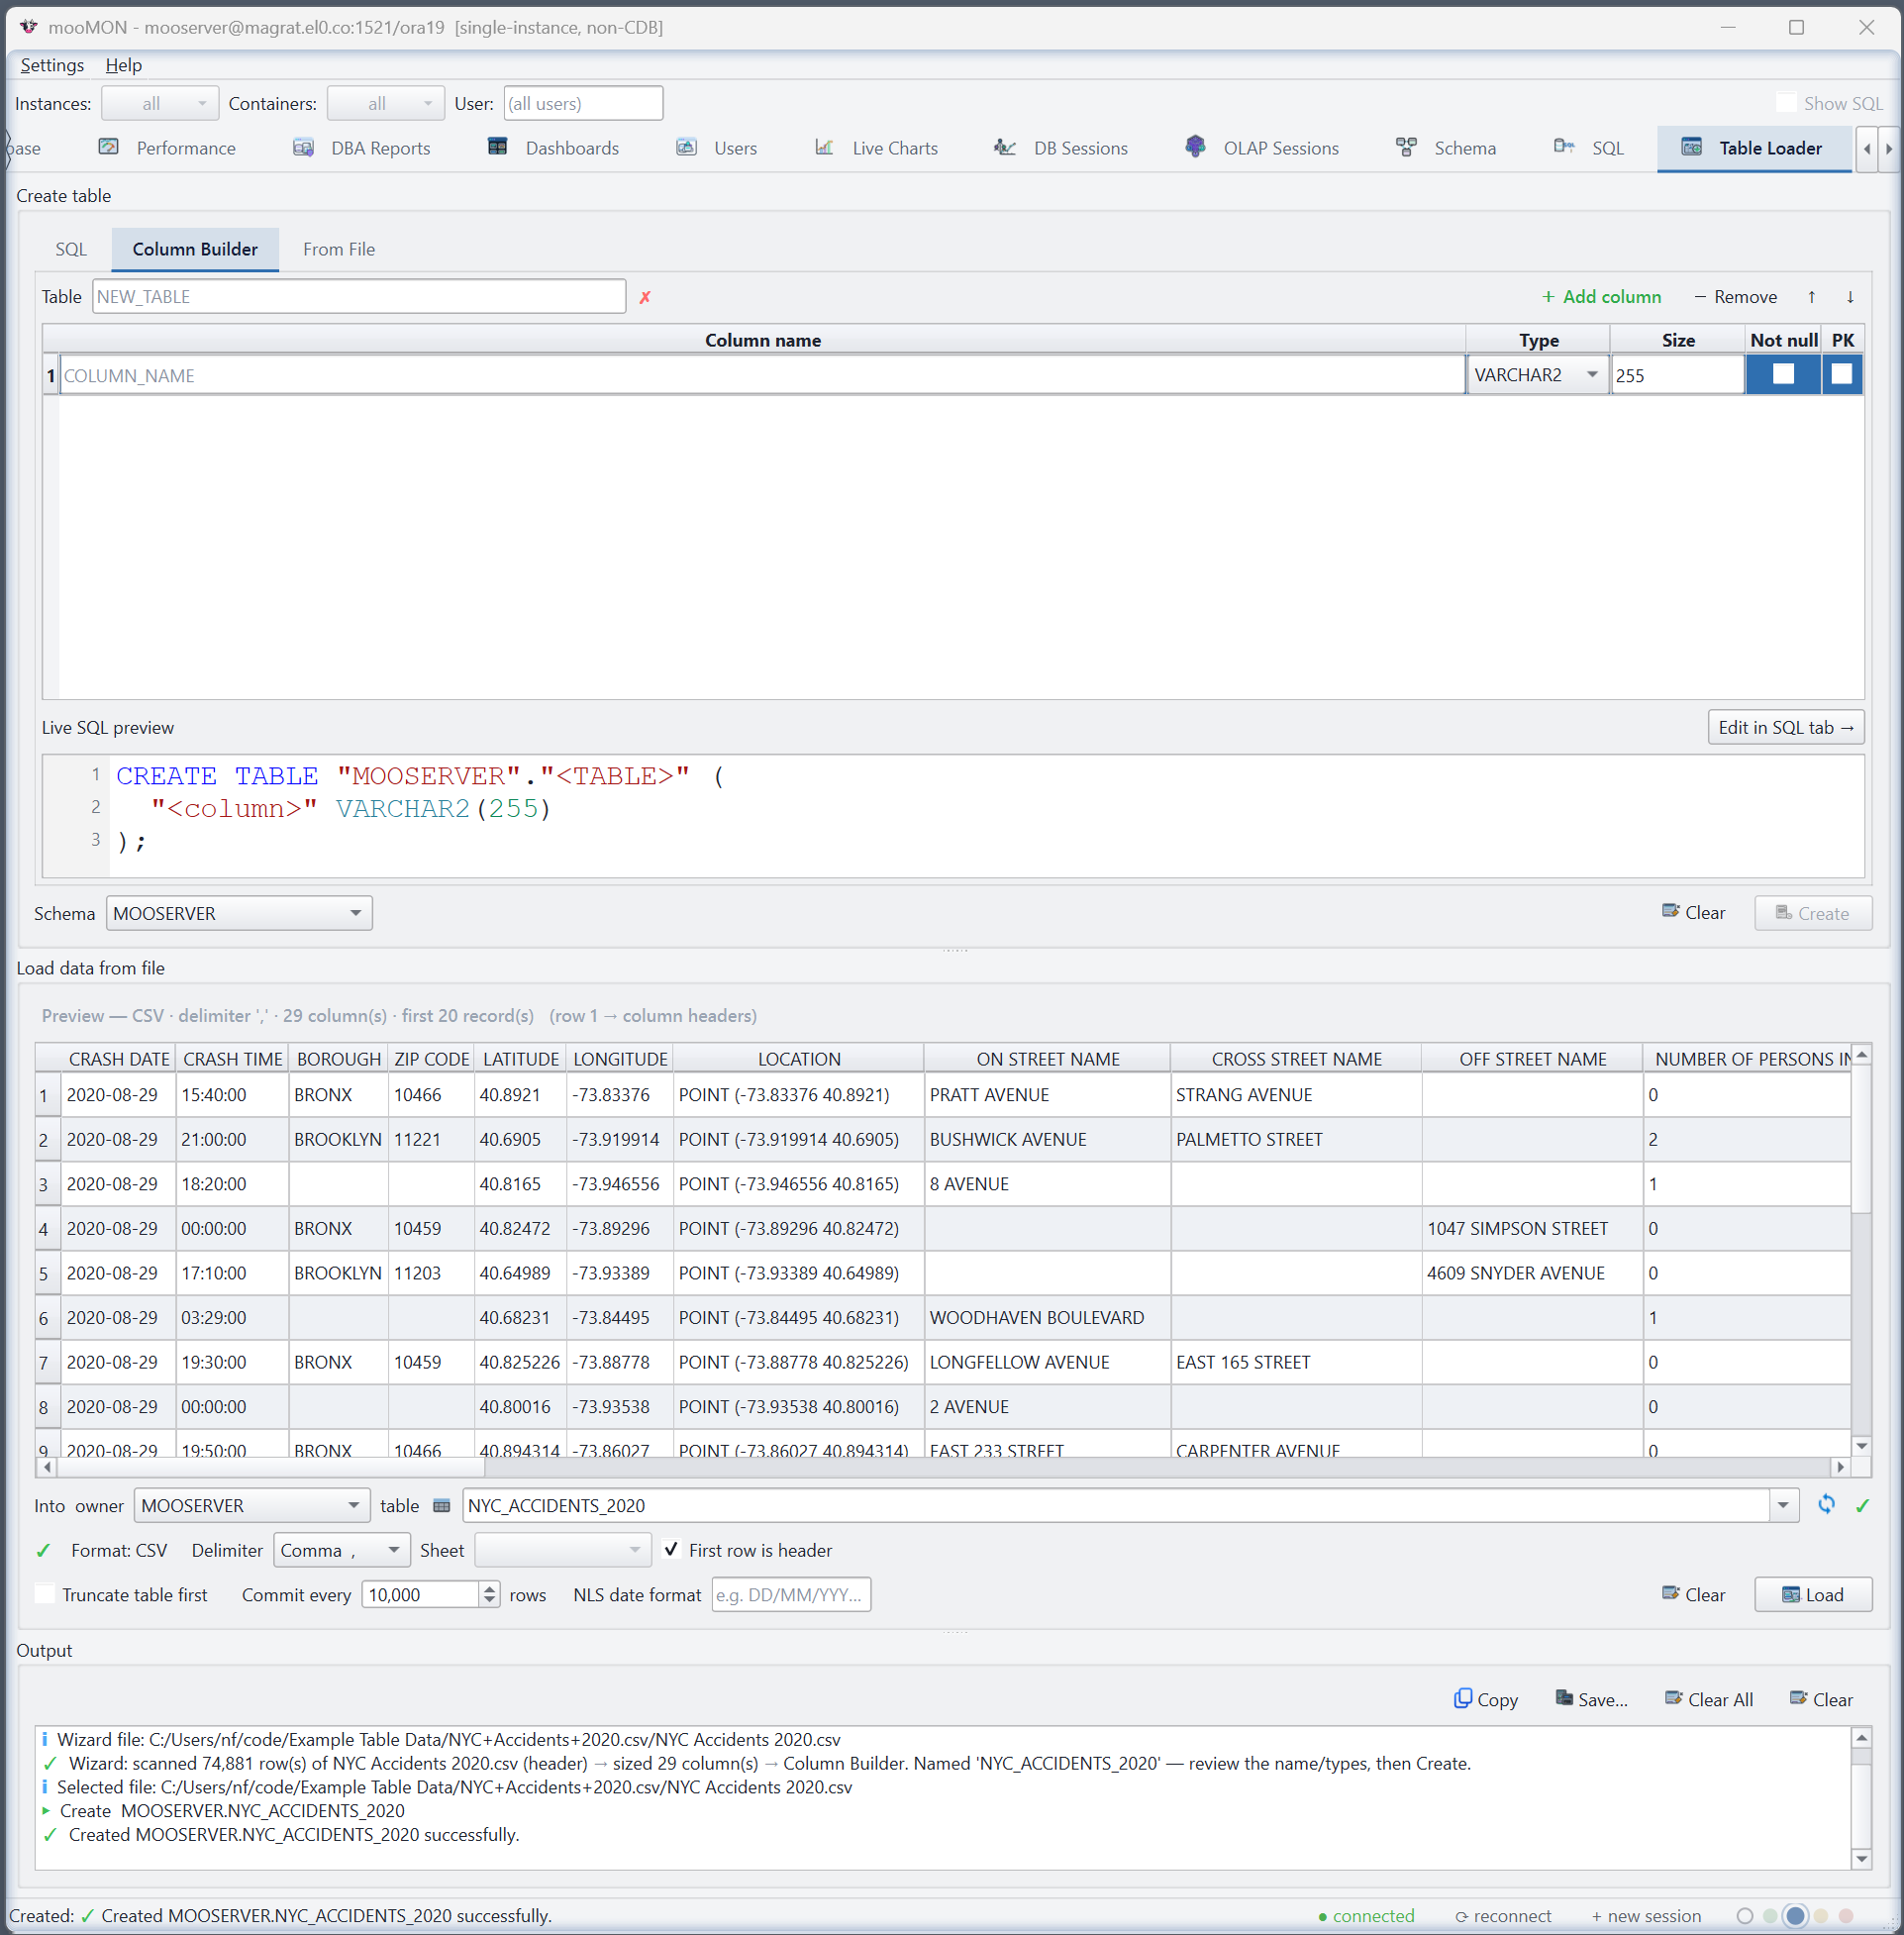
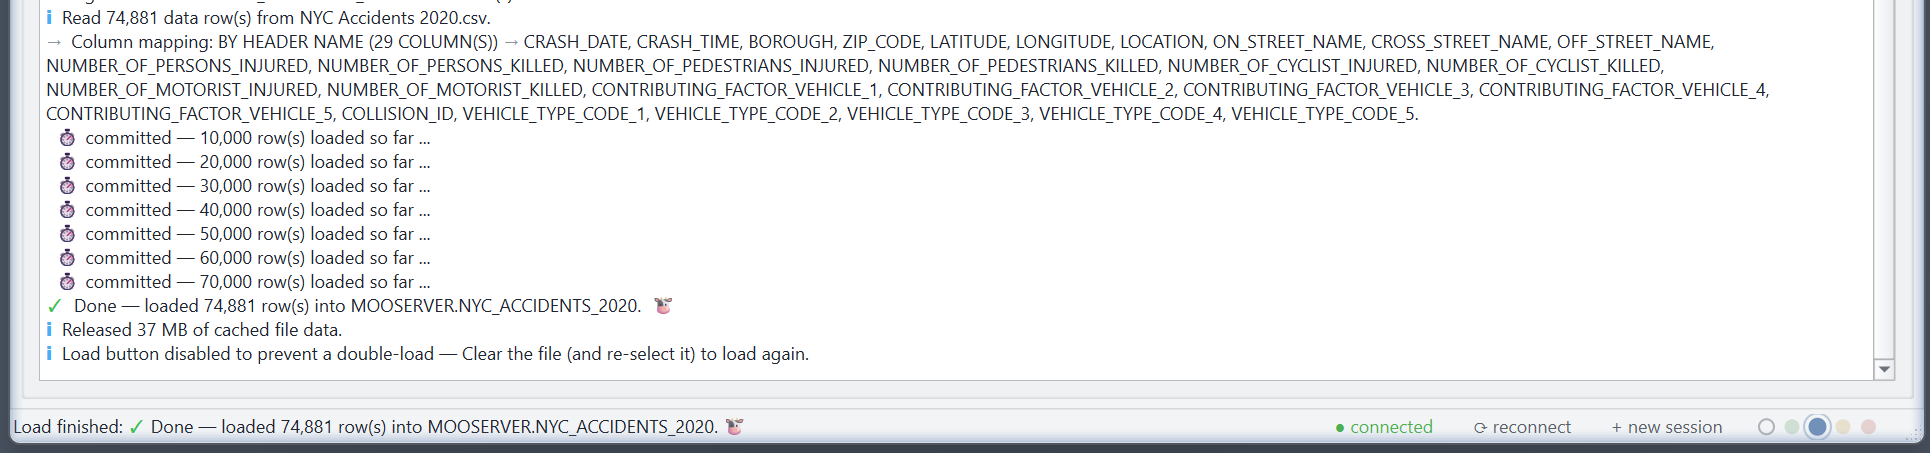
Create a table and bulk-load data into it without leaving mooMON. Build a table with the column builder, then load from a CSV, Excel or delimited file — mapping columns by header name or position. When it finishes, you get the row count.
The Users tab
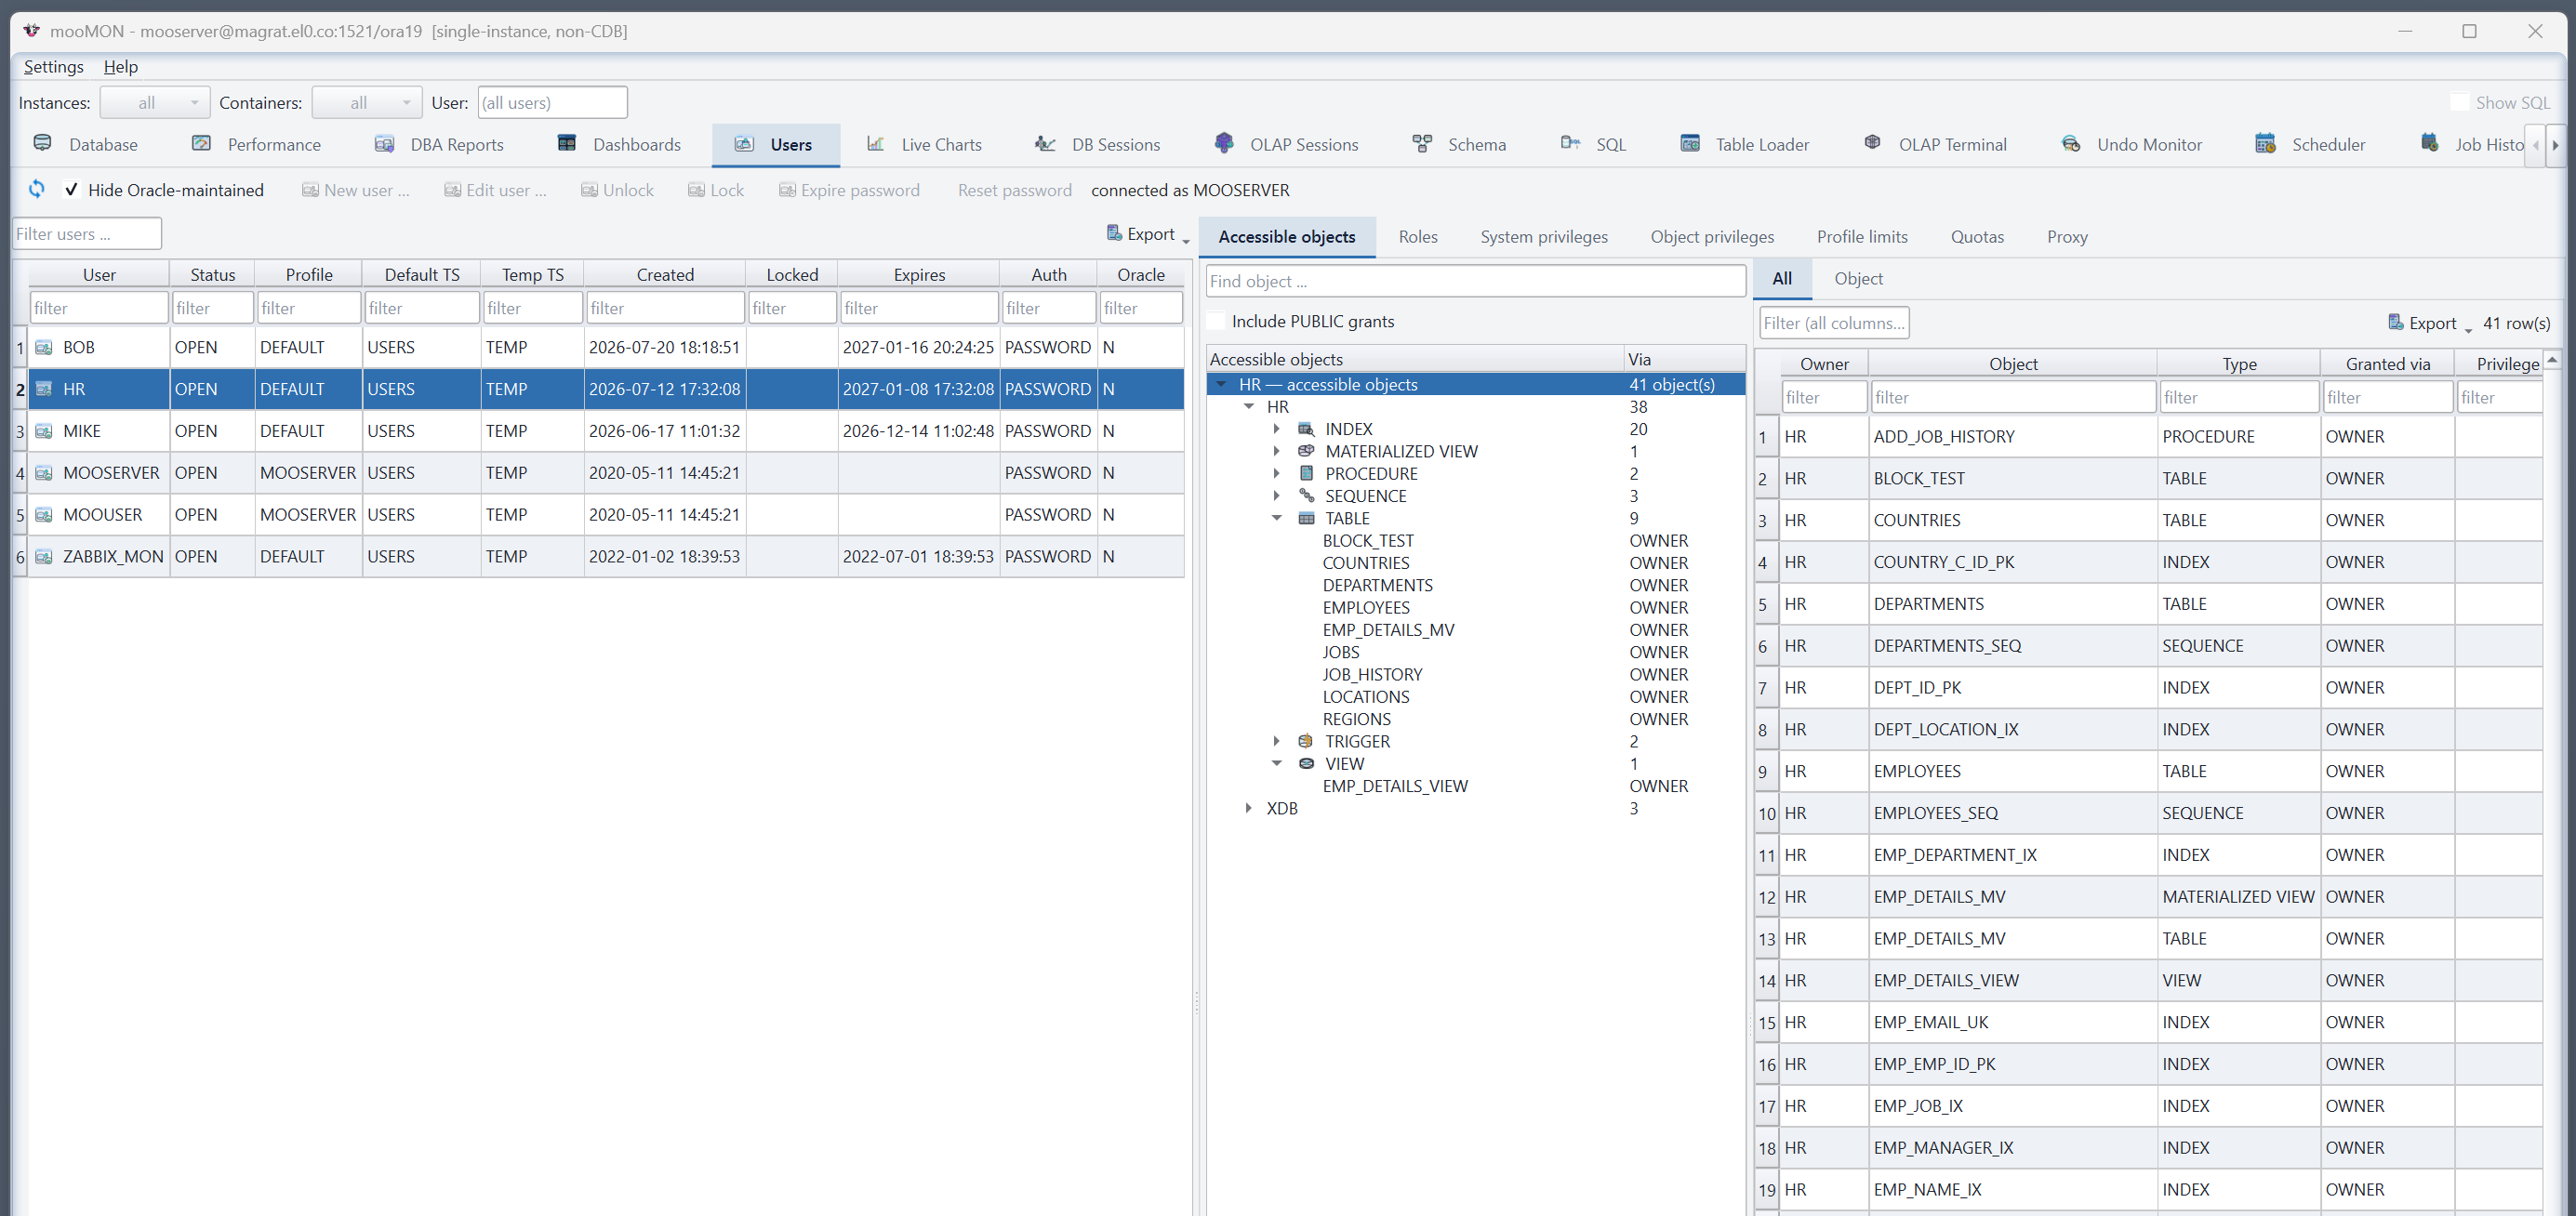
Pick a database user and see what they can reach and why: their profile and quotas, their proxies, and their privileges — including ones inherited through nested roles. It's the fast way to answer “can this account do X, and where did that come from?”
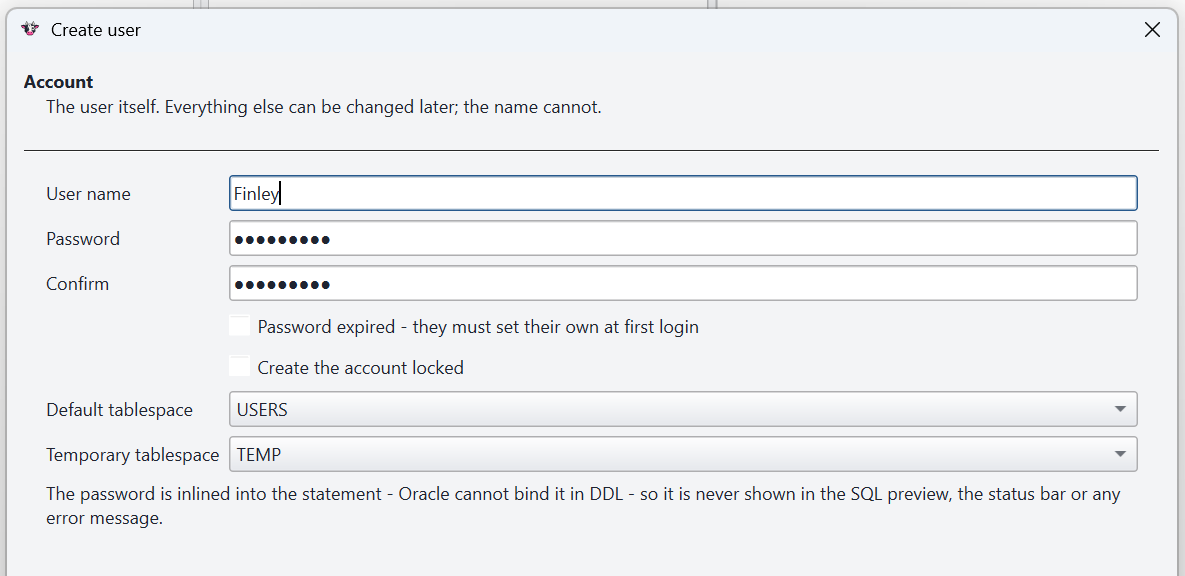
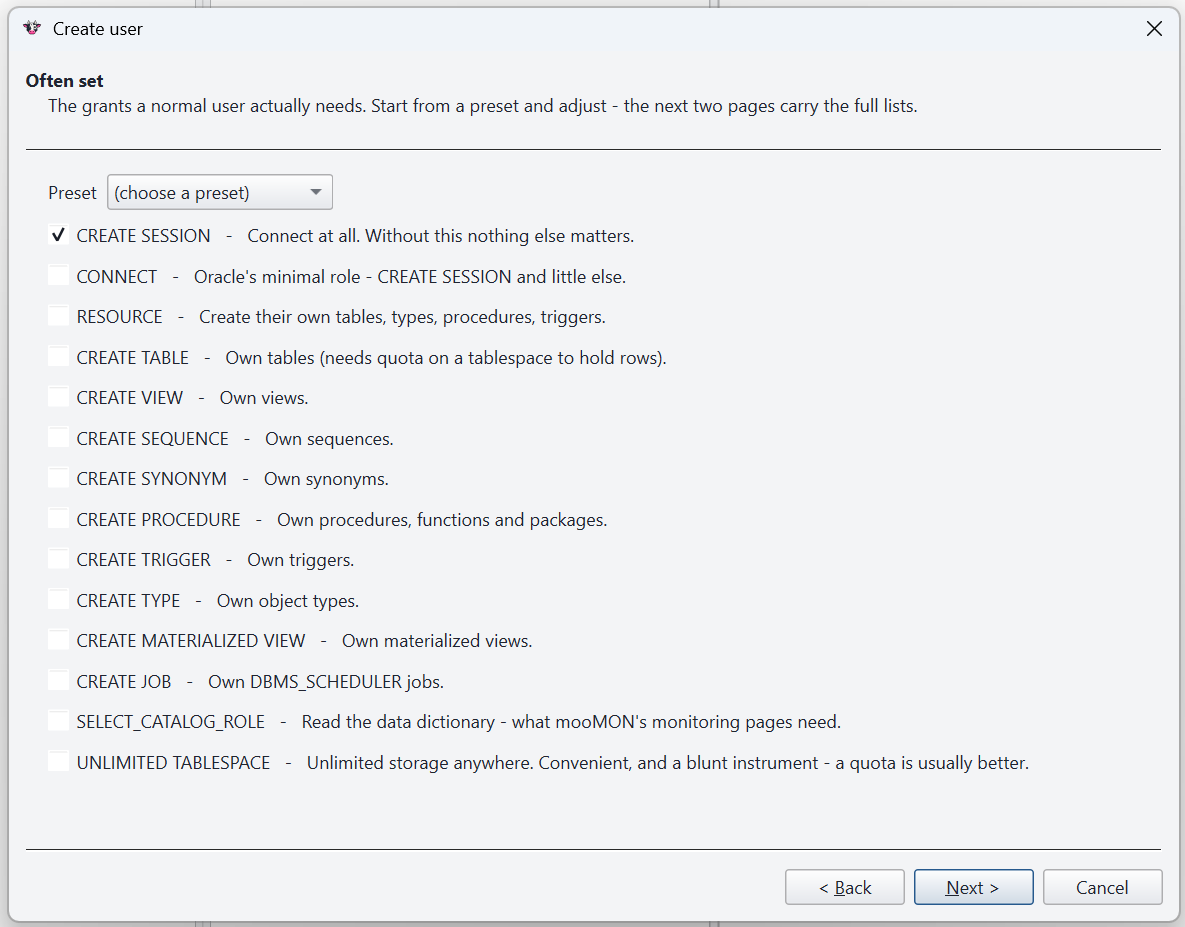
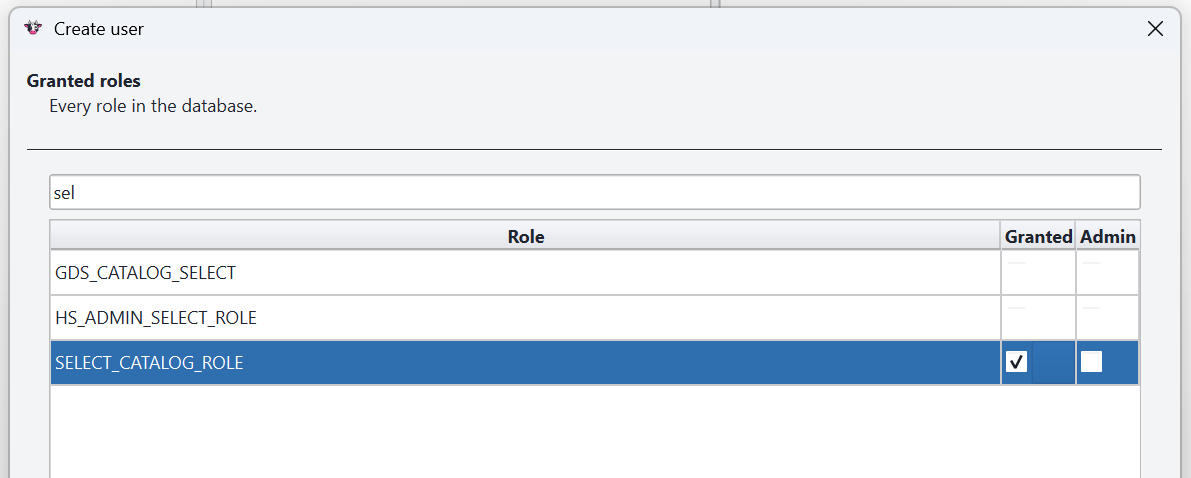
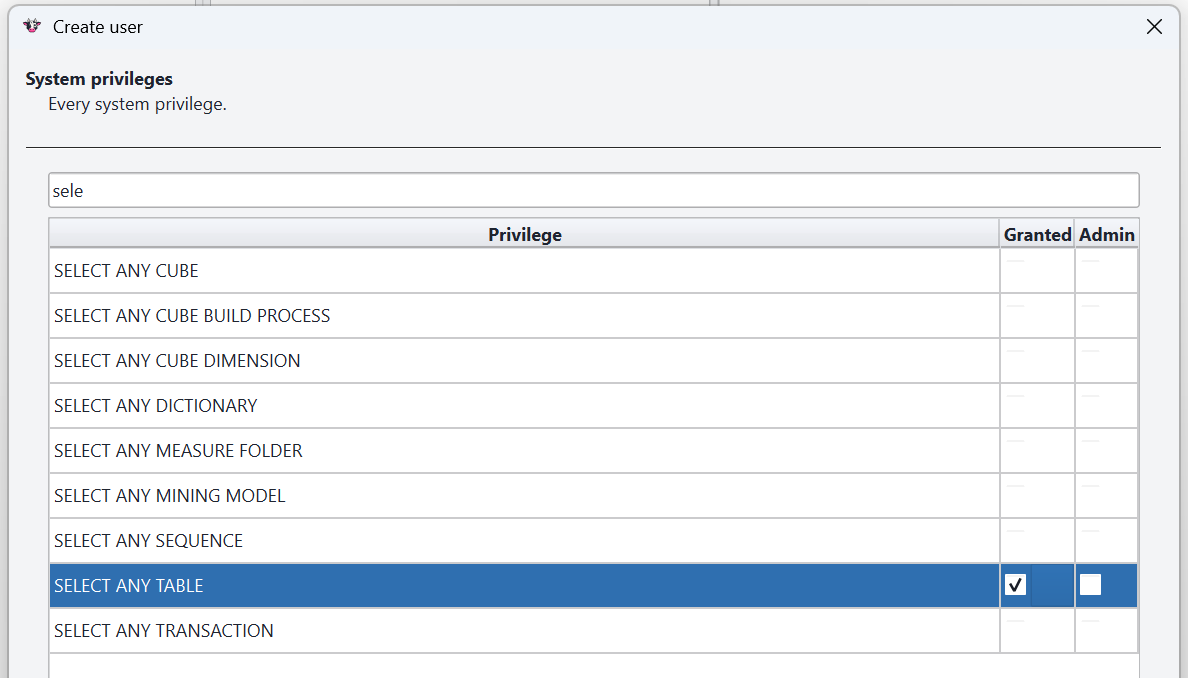
Create User wizard
A guided wizard walks through creating a user — identification, tablespaces and quotas, roles and privileges — and shows you the exact SQL it will run before you commit to it.
Scheduler
A window onto DBMS_SCHEDULER: jobs and their wiring — programs, schedules, chains
and windows — together with file watchers and recent runs, so you can see what's scheduled and
what fired.
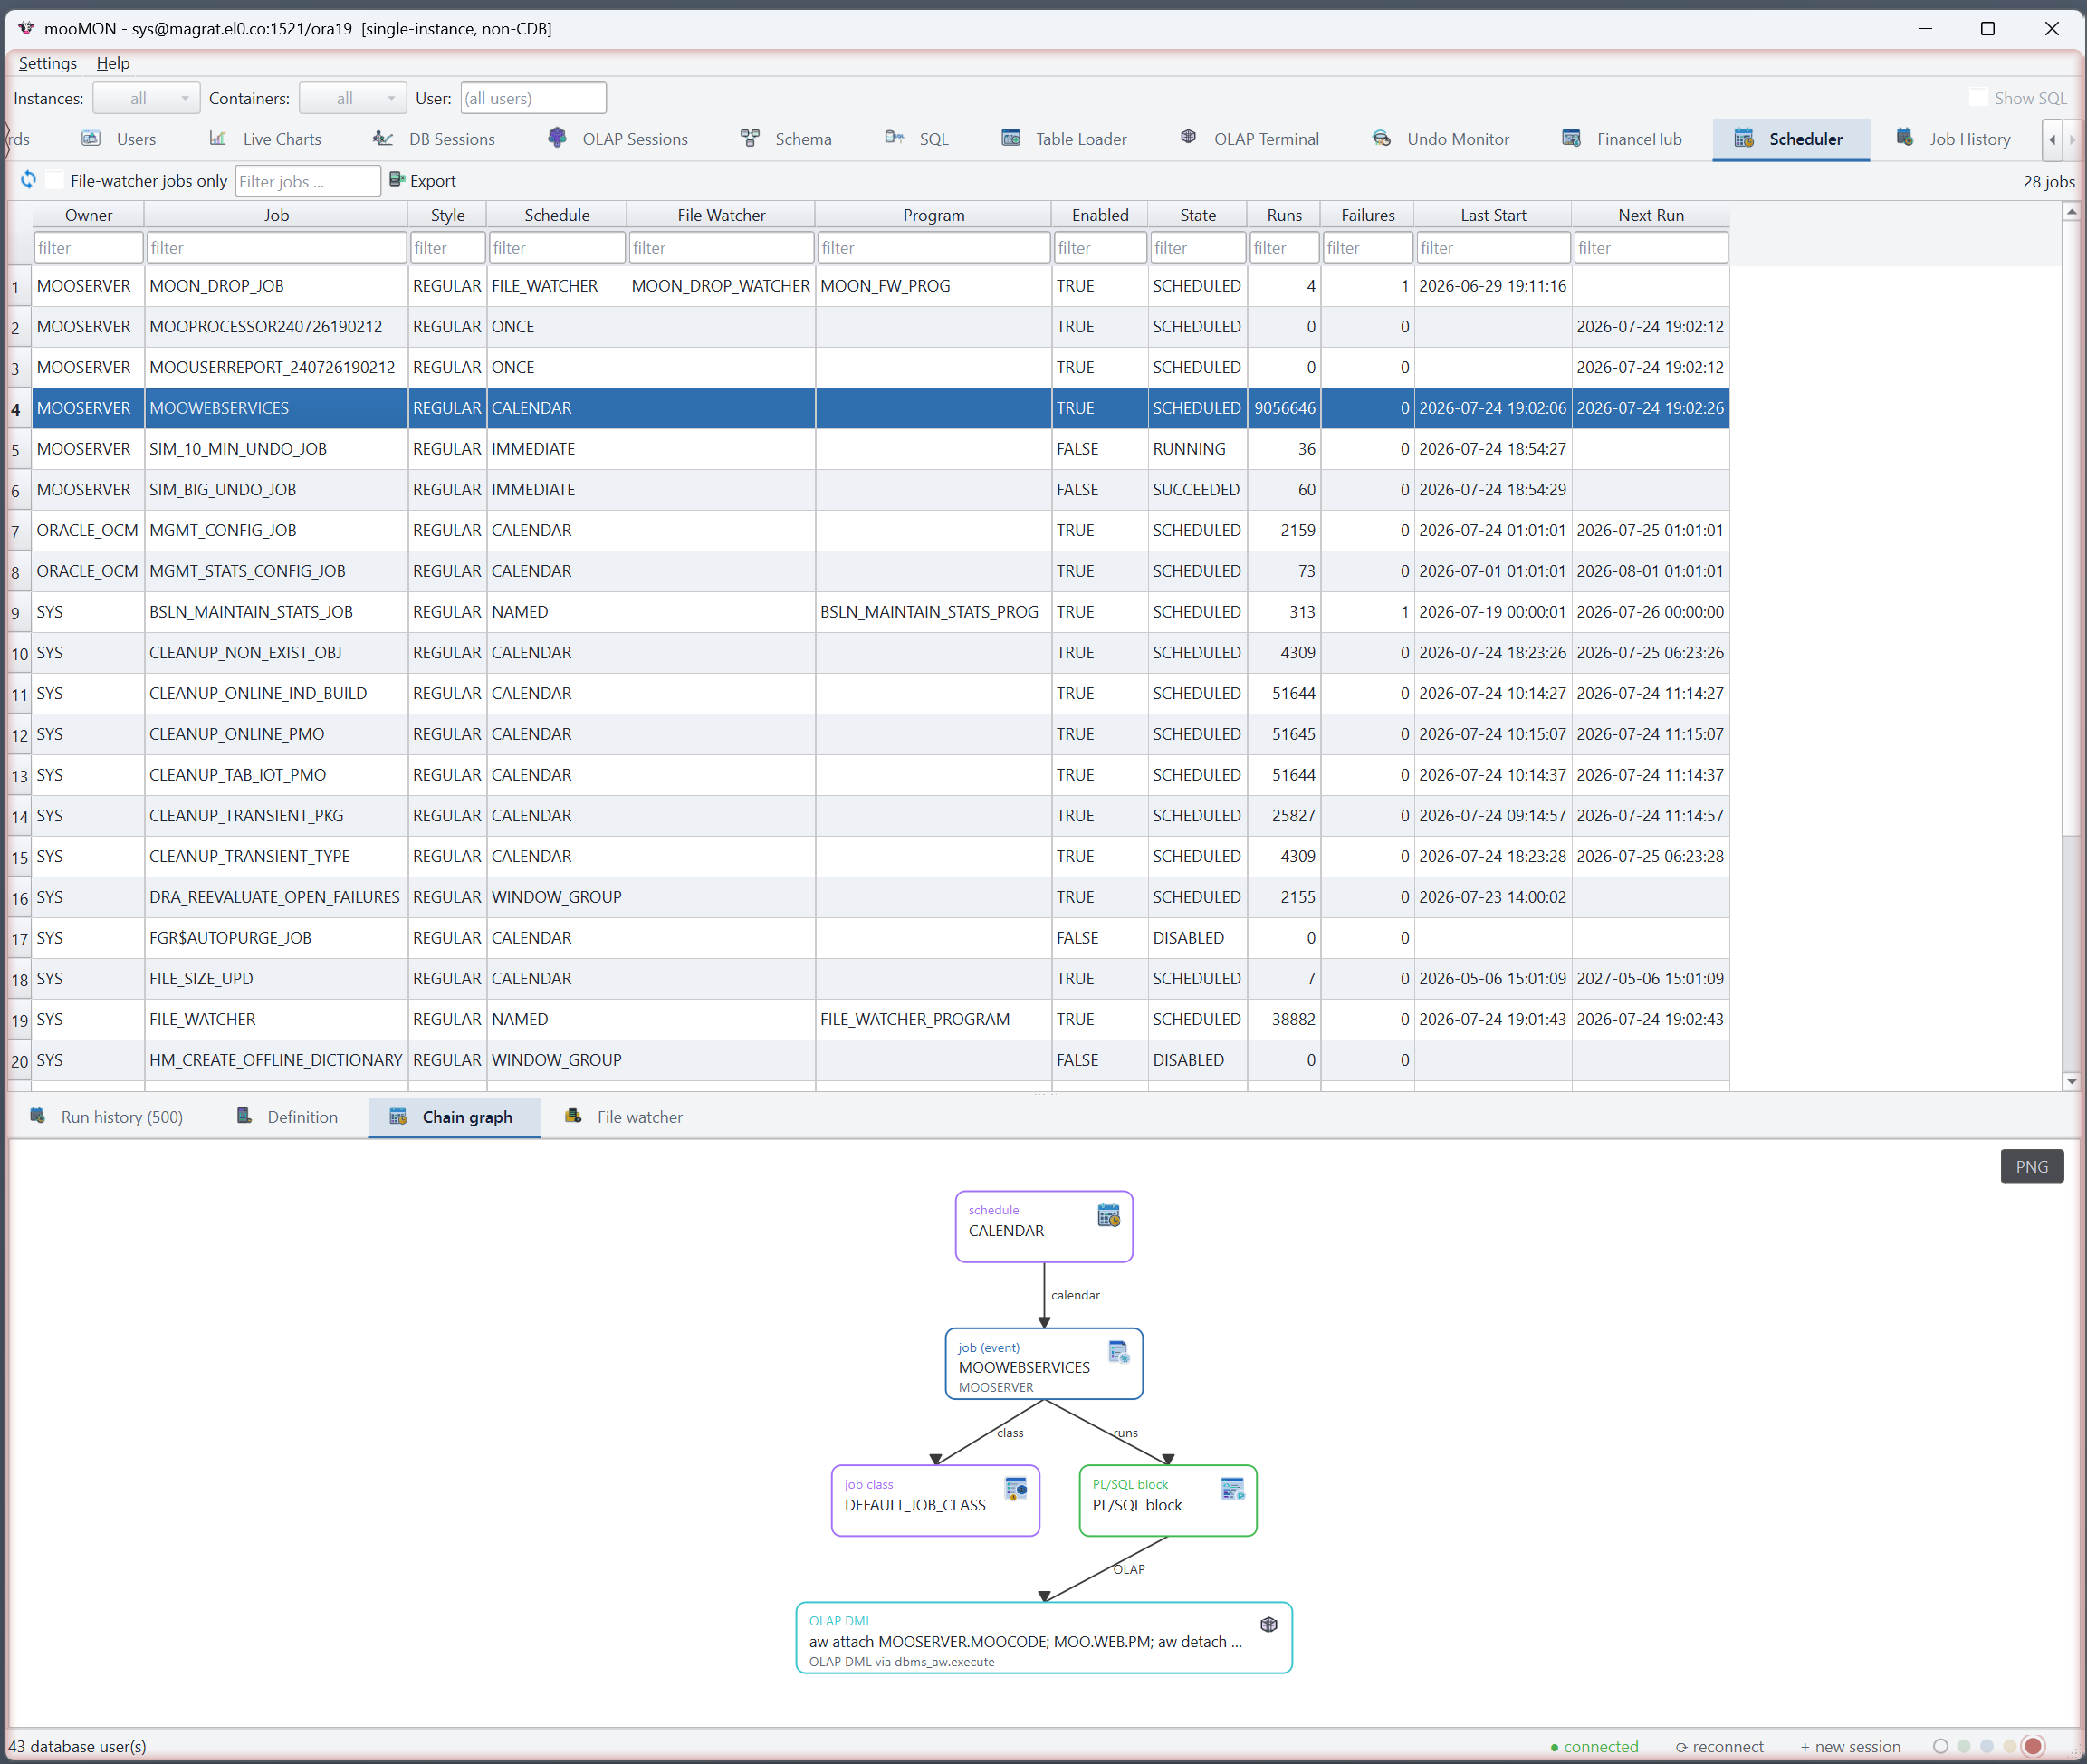
Job History
Run history for scheduled work, with the chain reconstructed as a graph so you can follow how one step led to the next. Right-click a job row anywhere in mooMON to jump straight here.
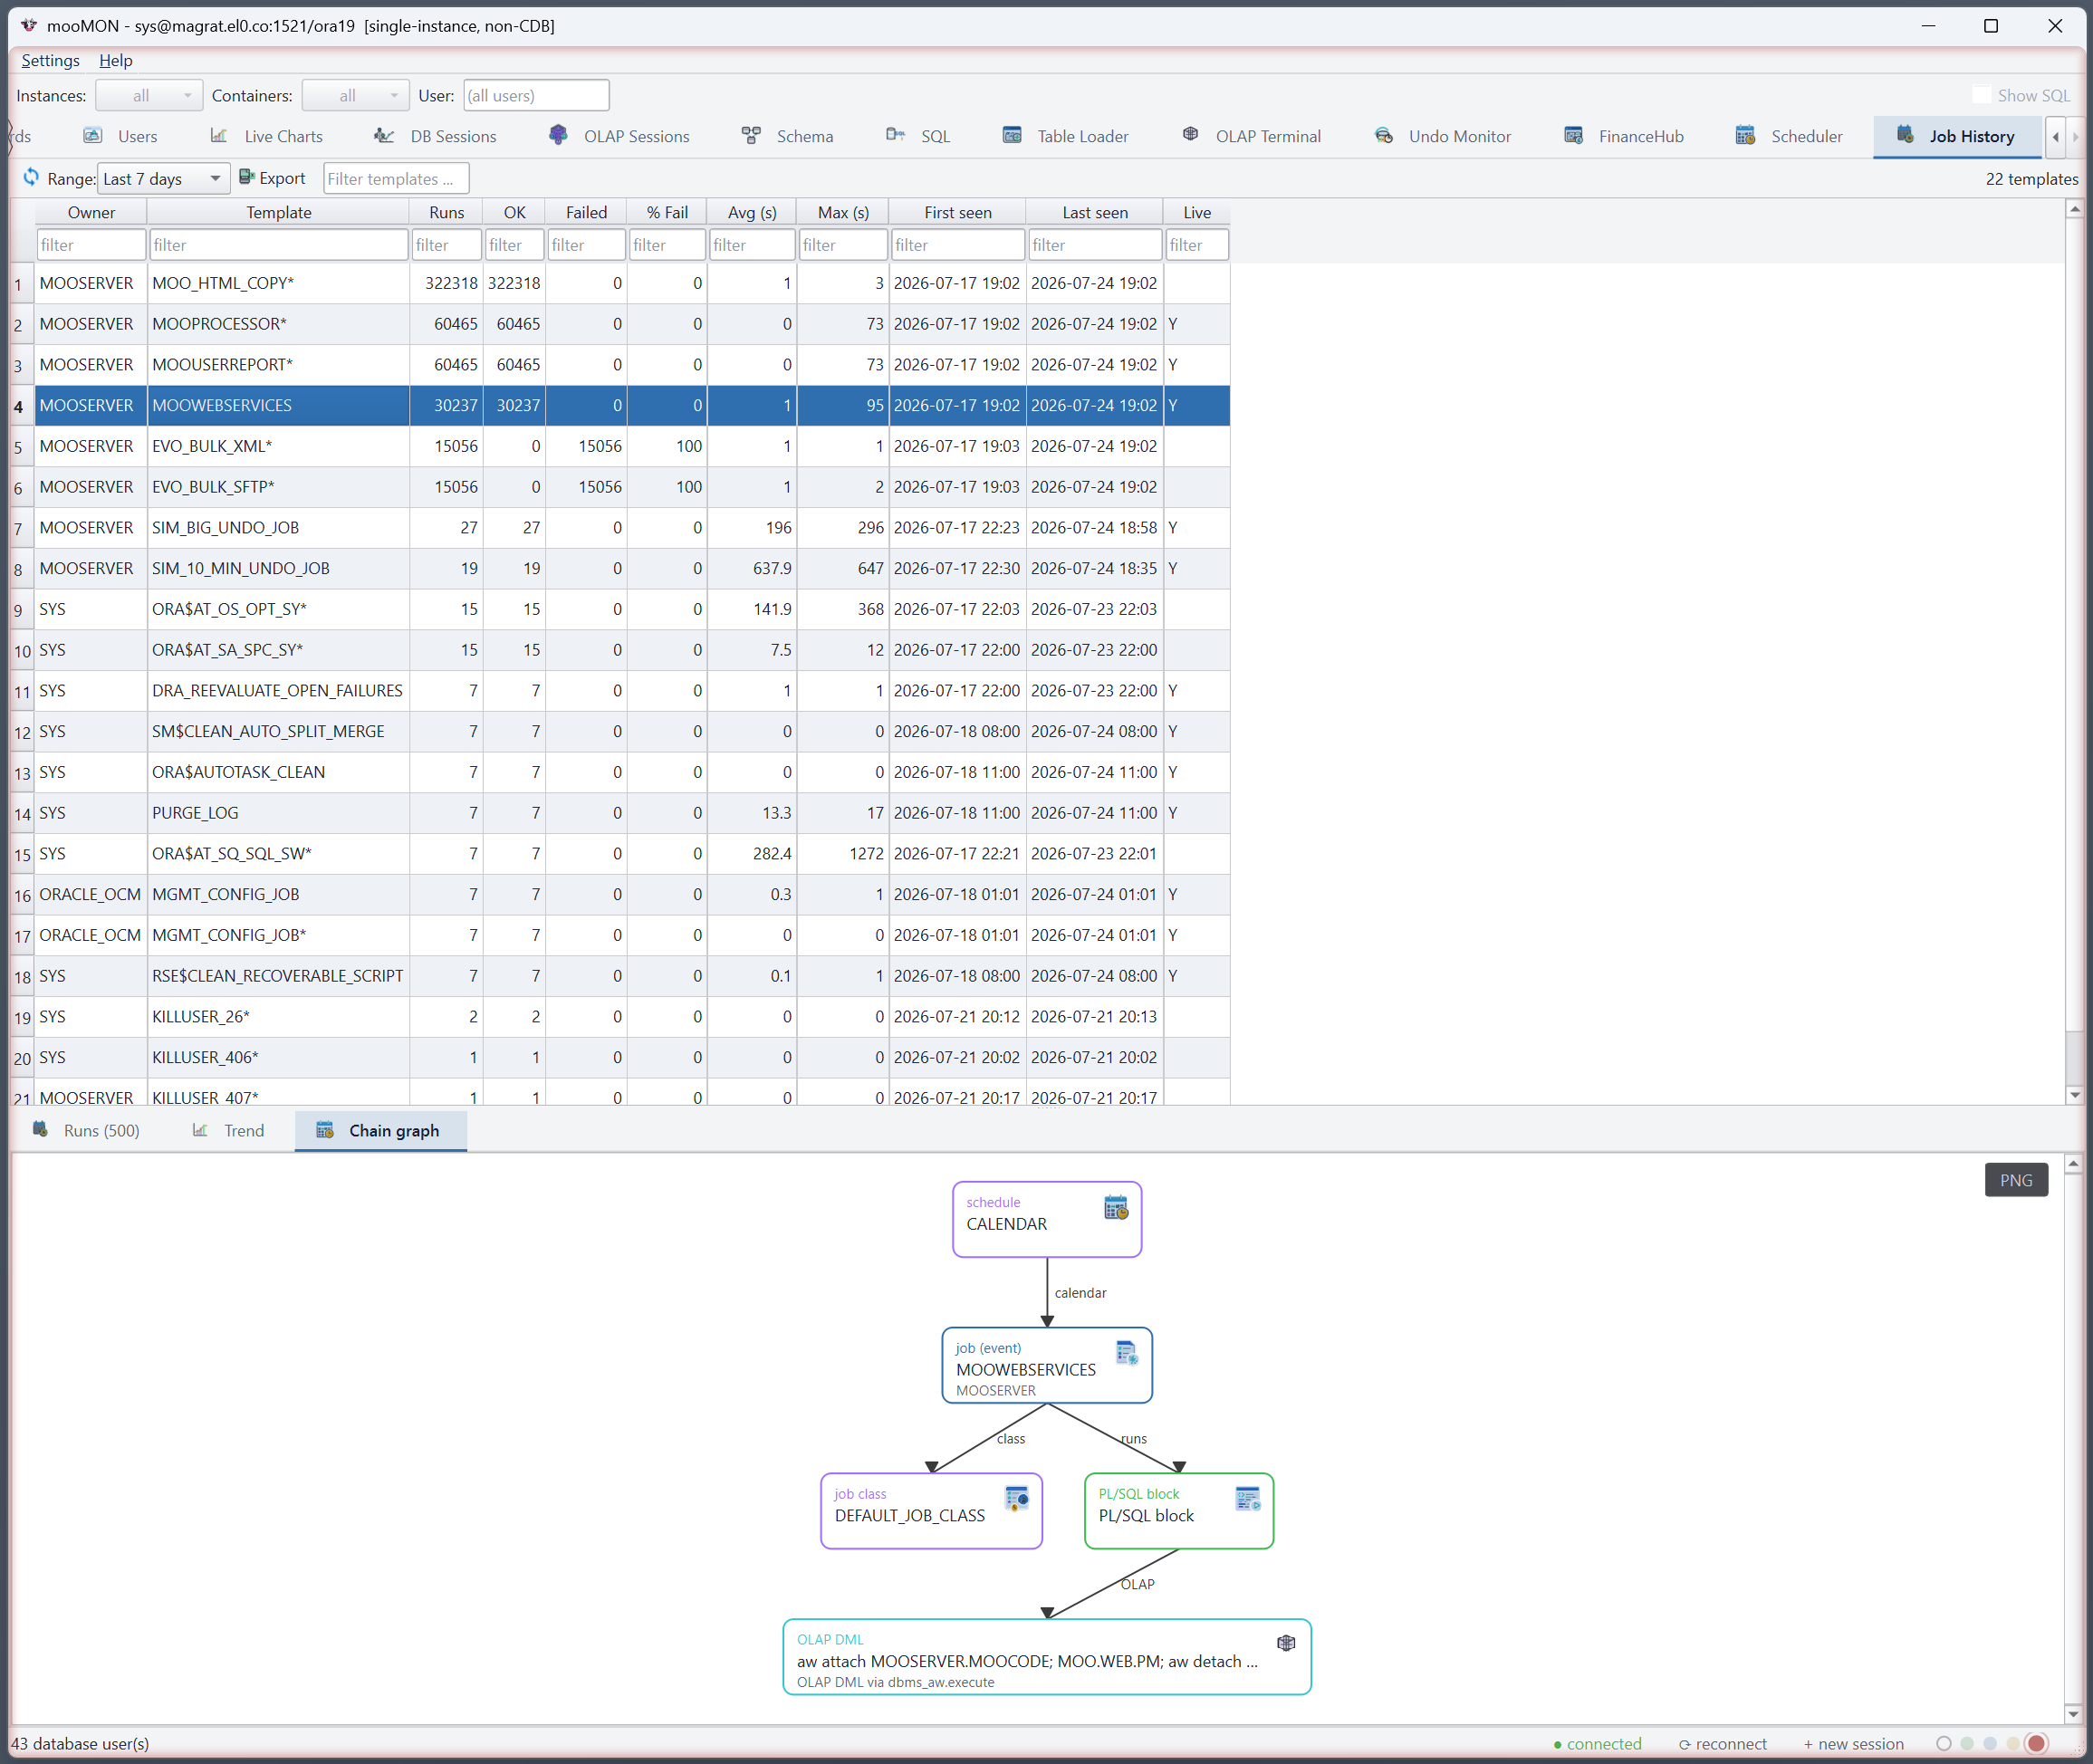
A job in detail
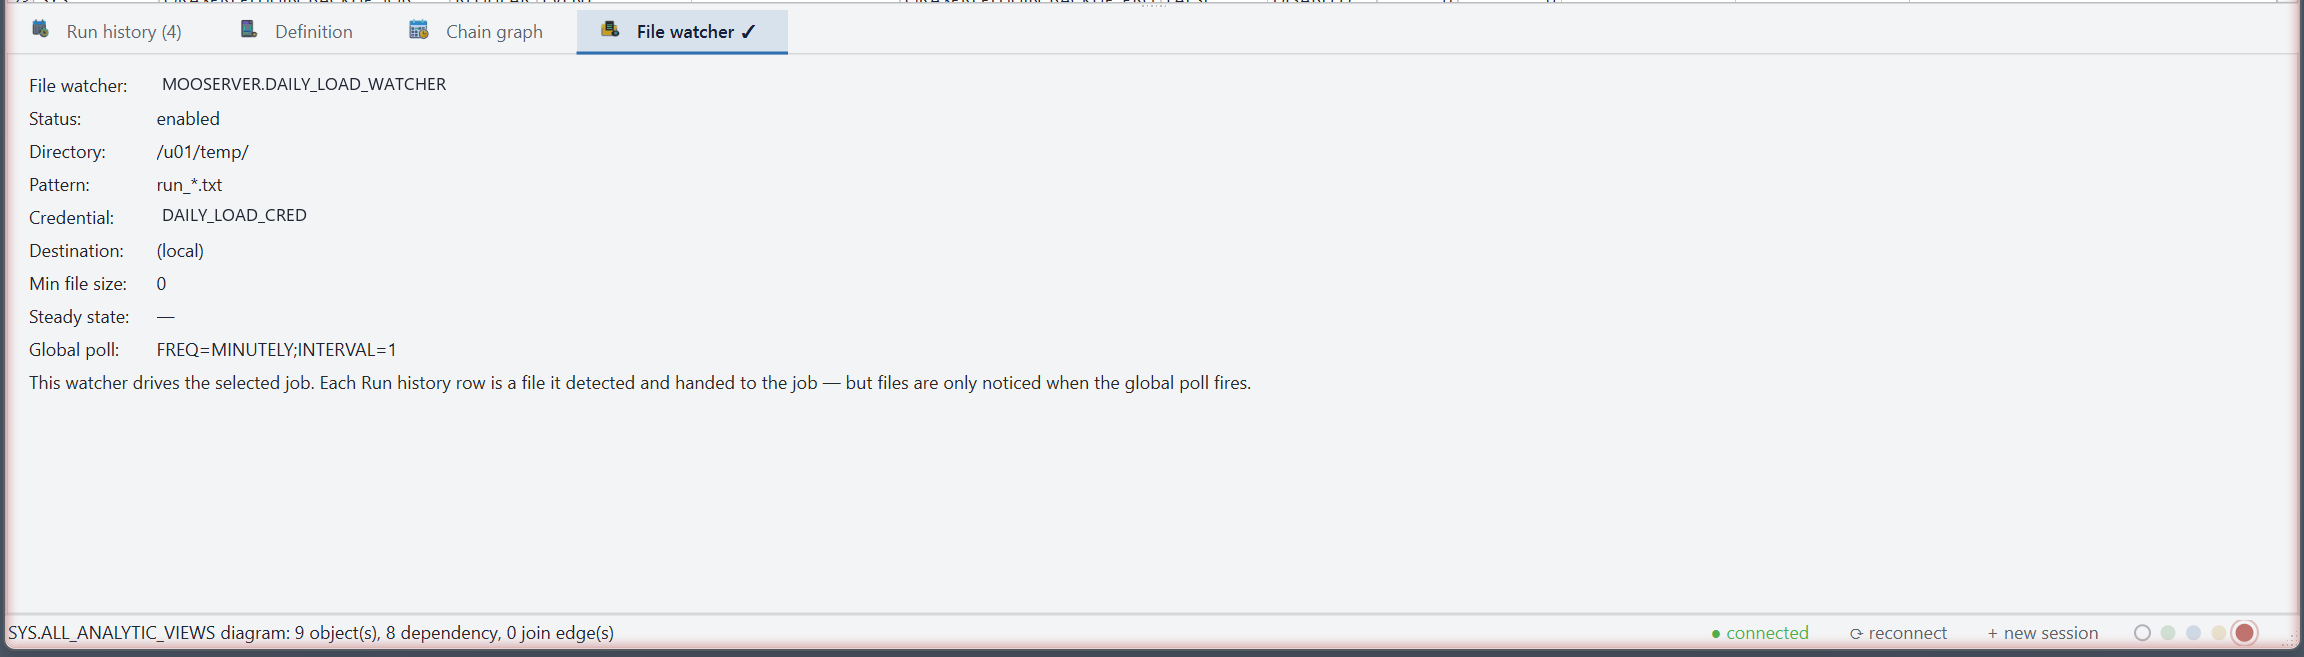
The Scheduler lists every job — owner, schedule, program, run and failure counts, next run. Selecting one opens detail tabs beneath the grid: its run history, its definition, a chain graph tracing how it triggers downstream work, and — for file-watcher jobs — the watcher configuration.
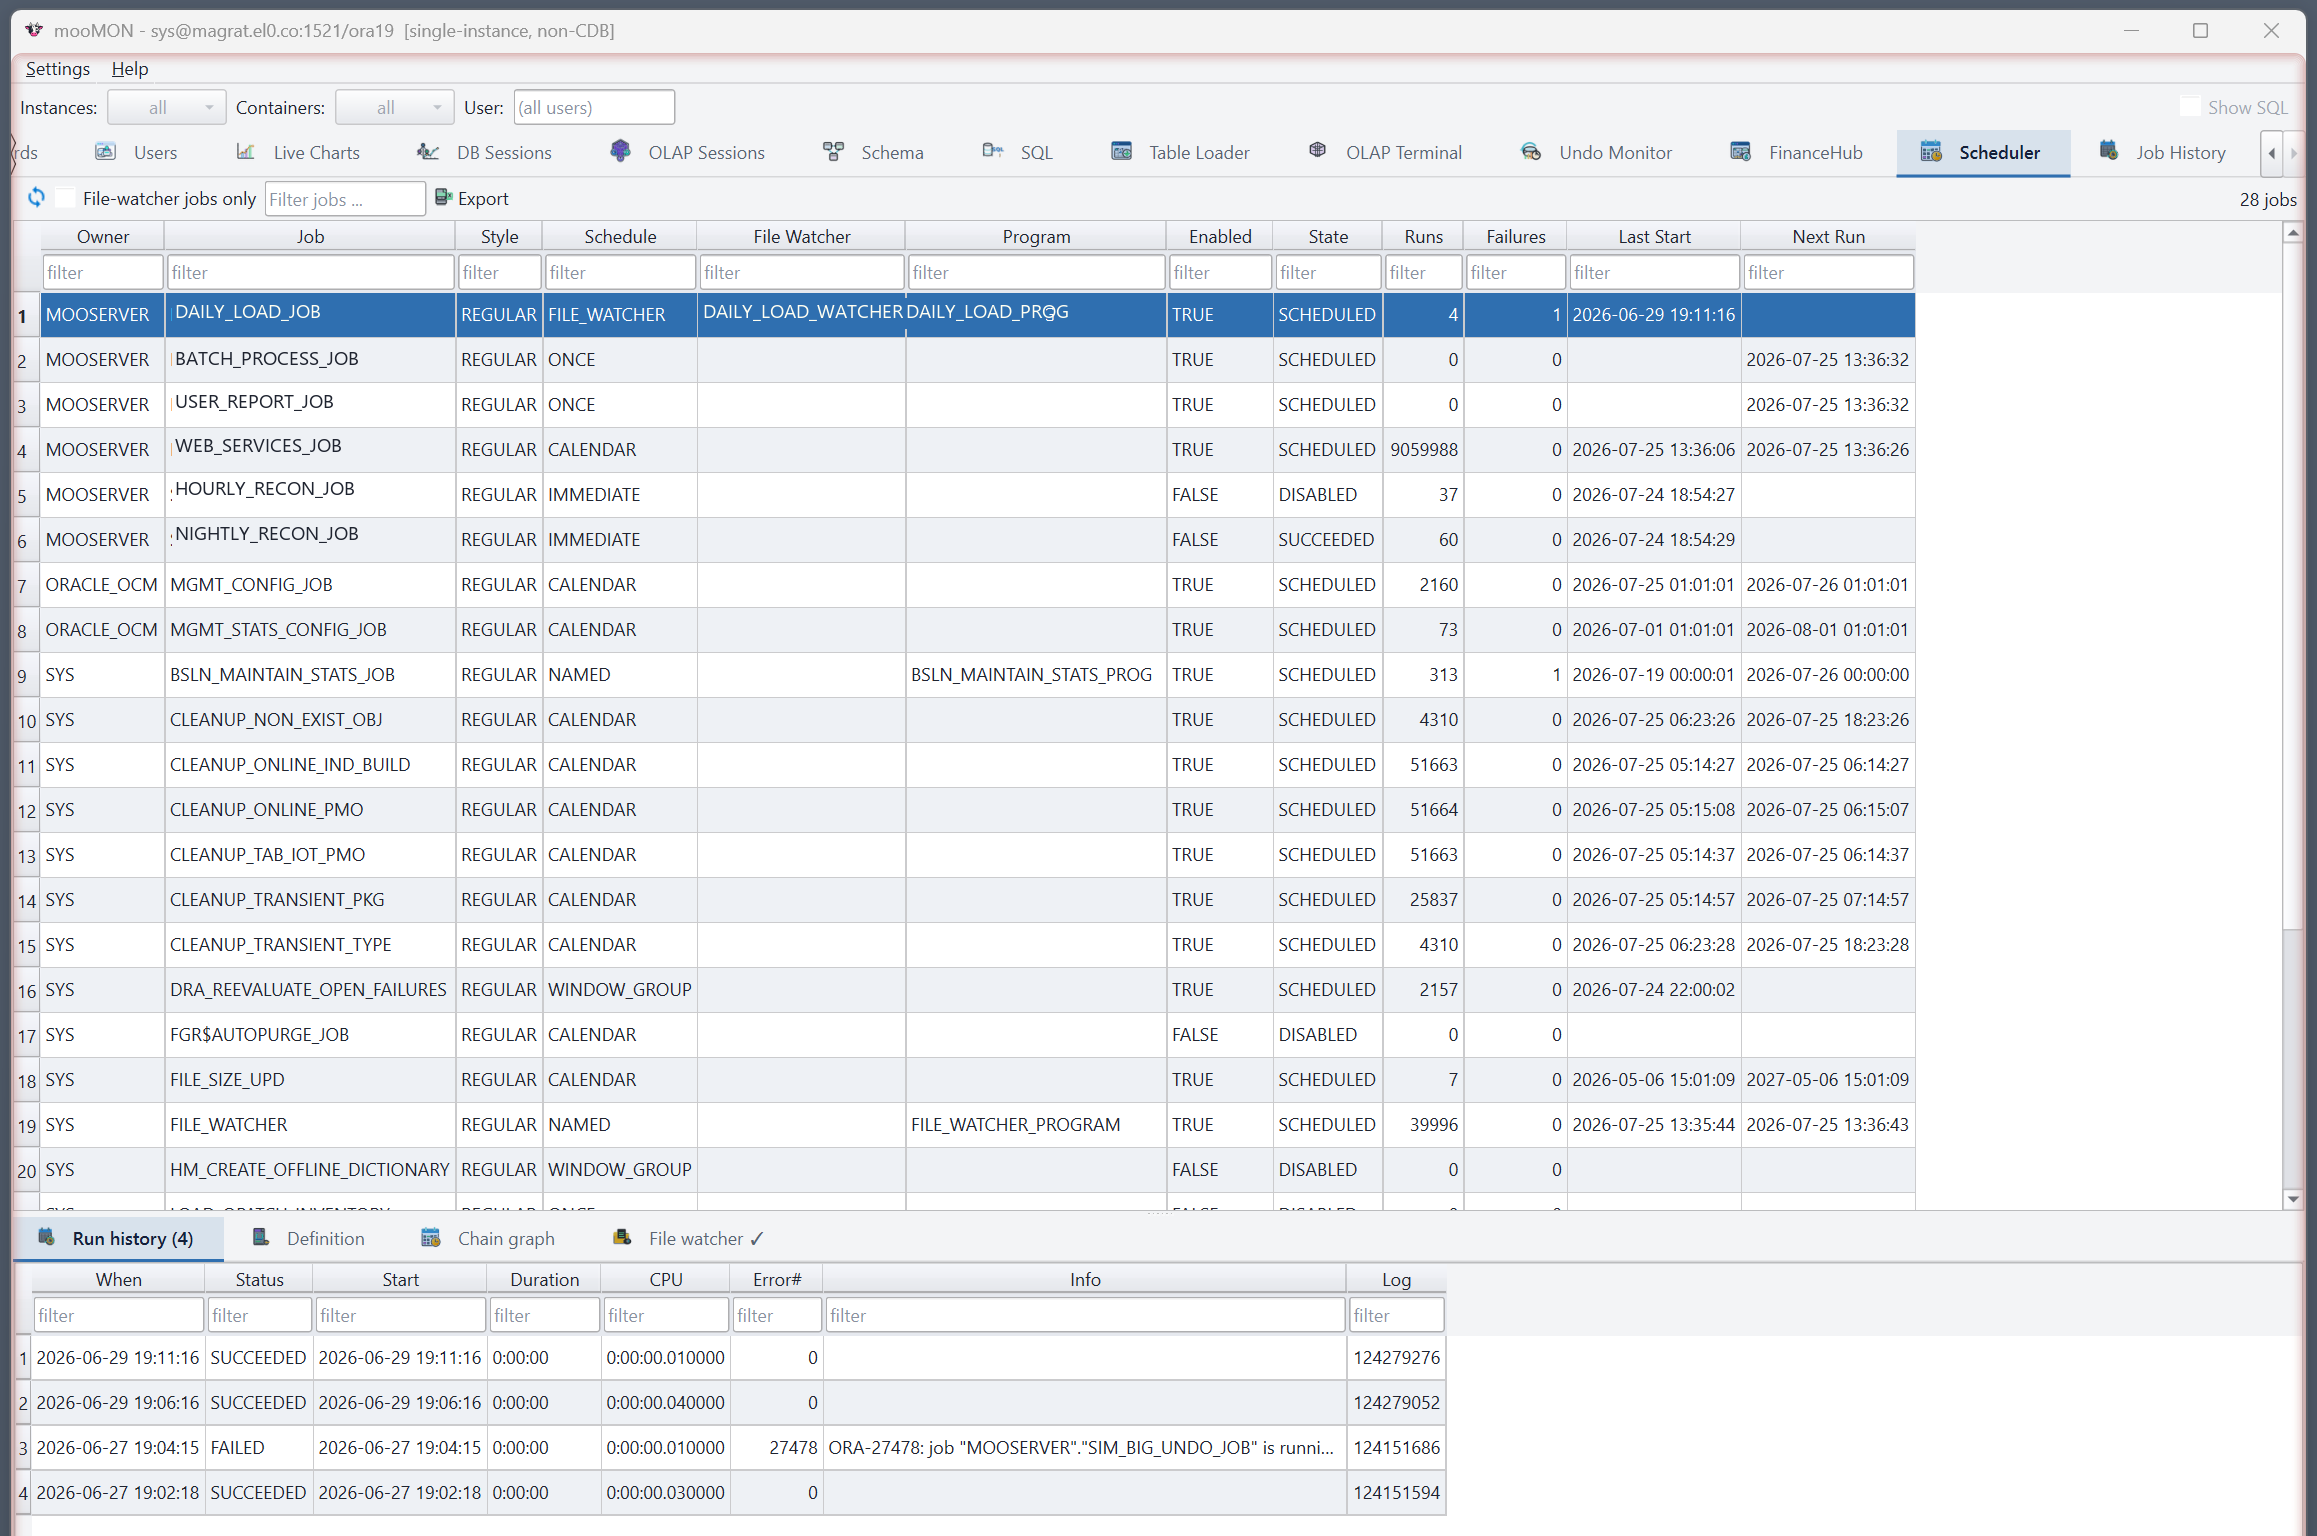
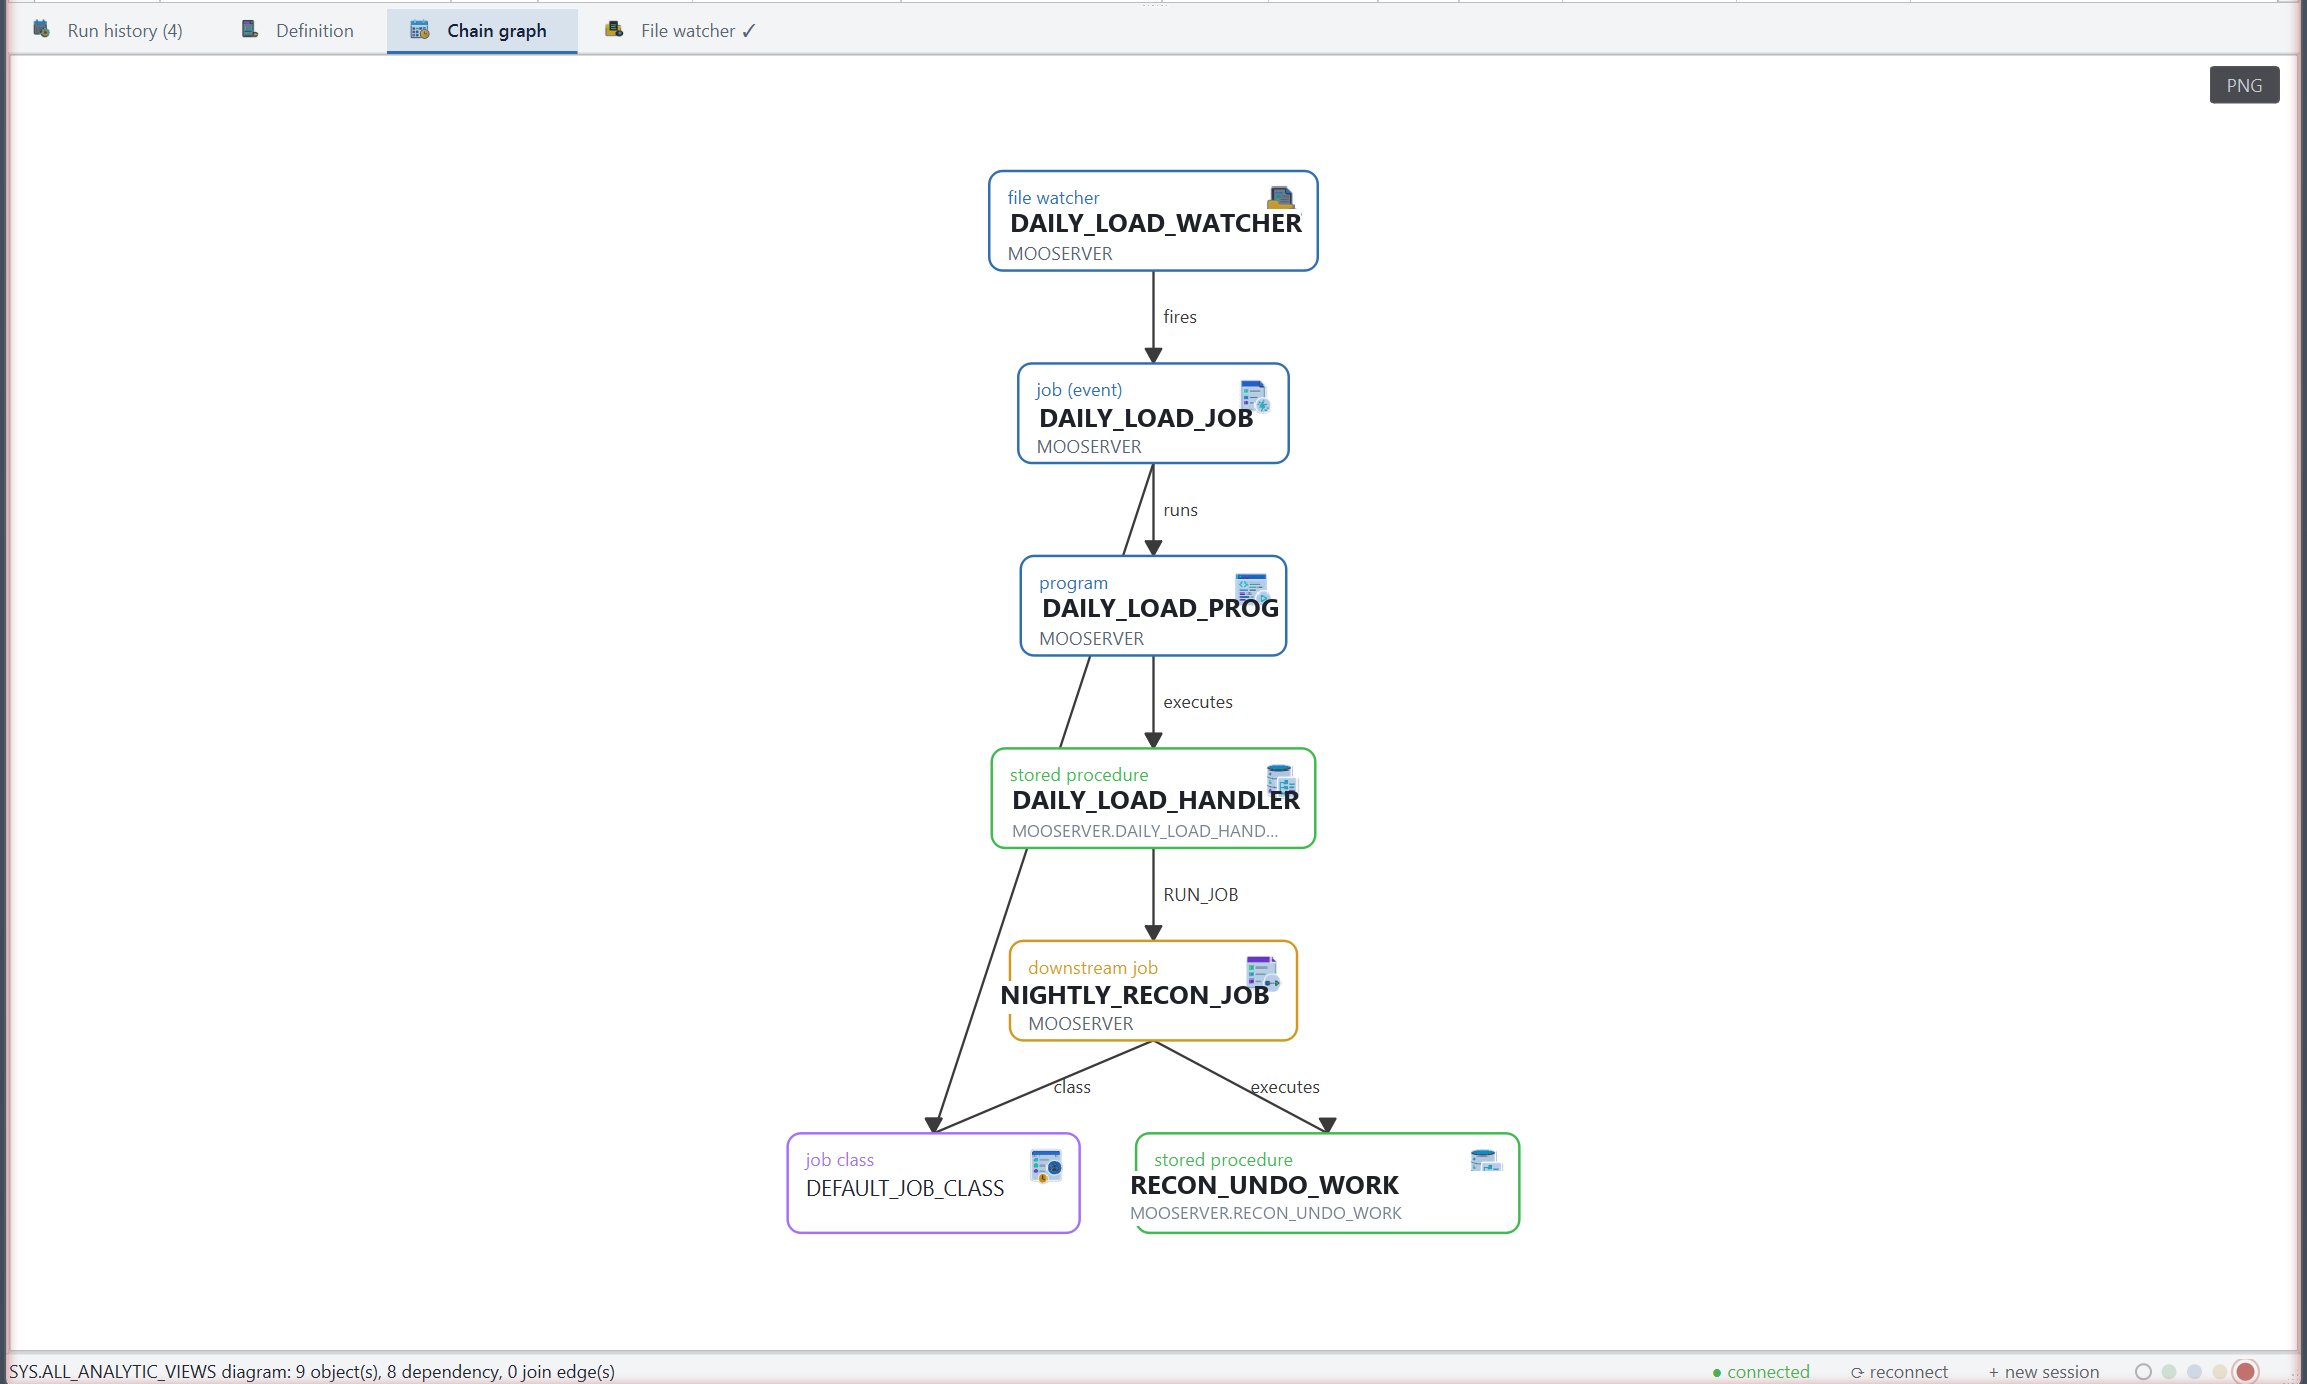
The chain graph is the quickest way to understand a multi-step job:
OLAP Terminal
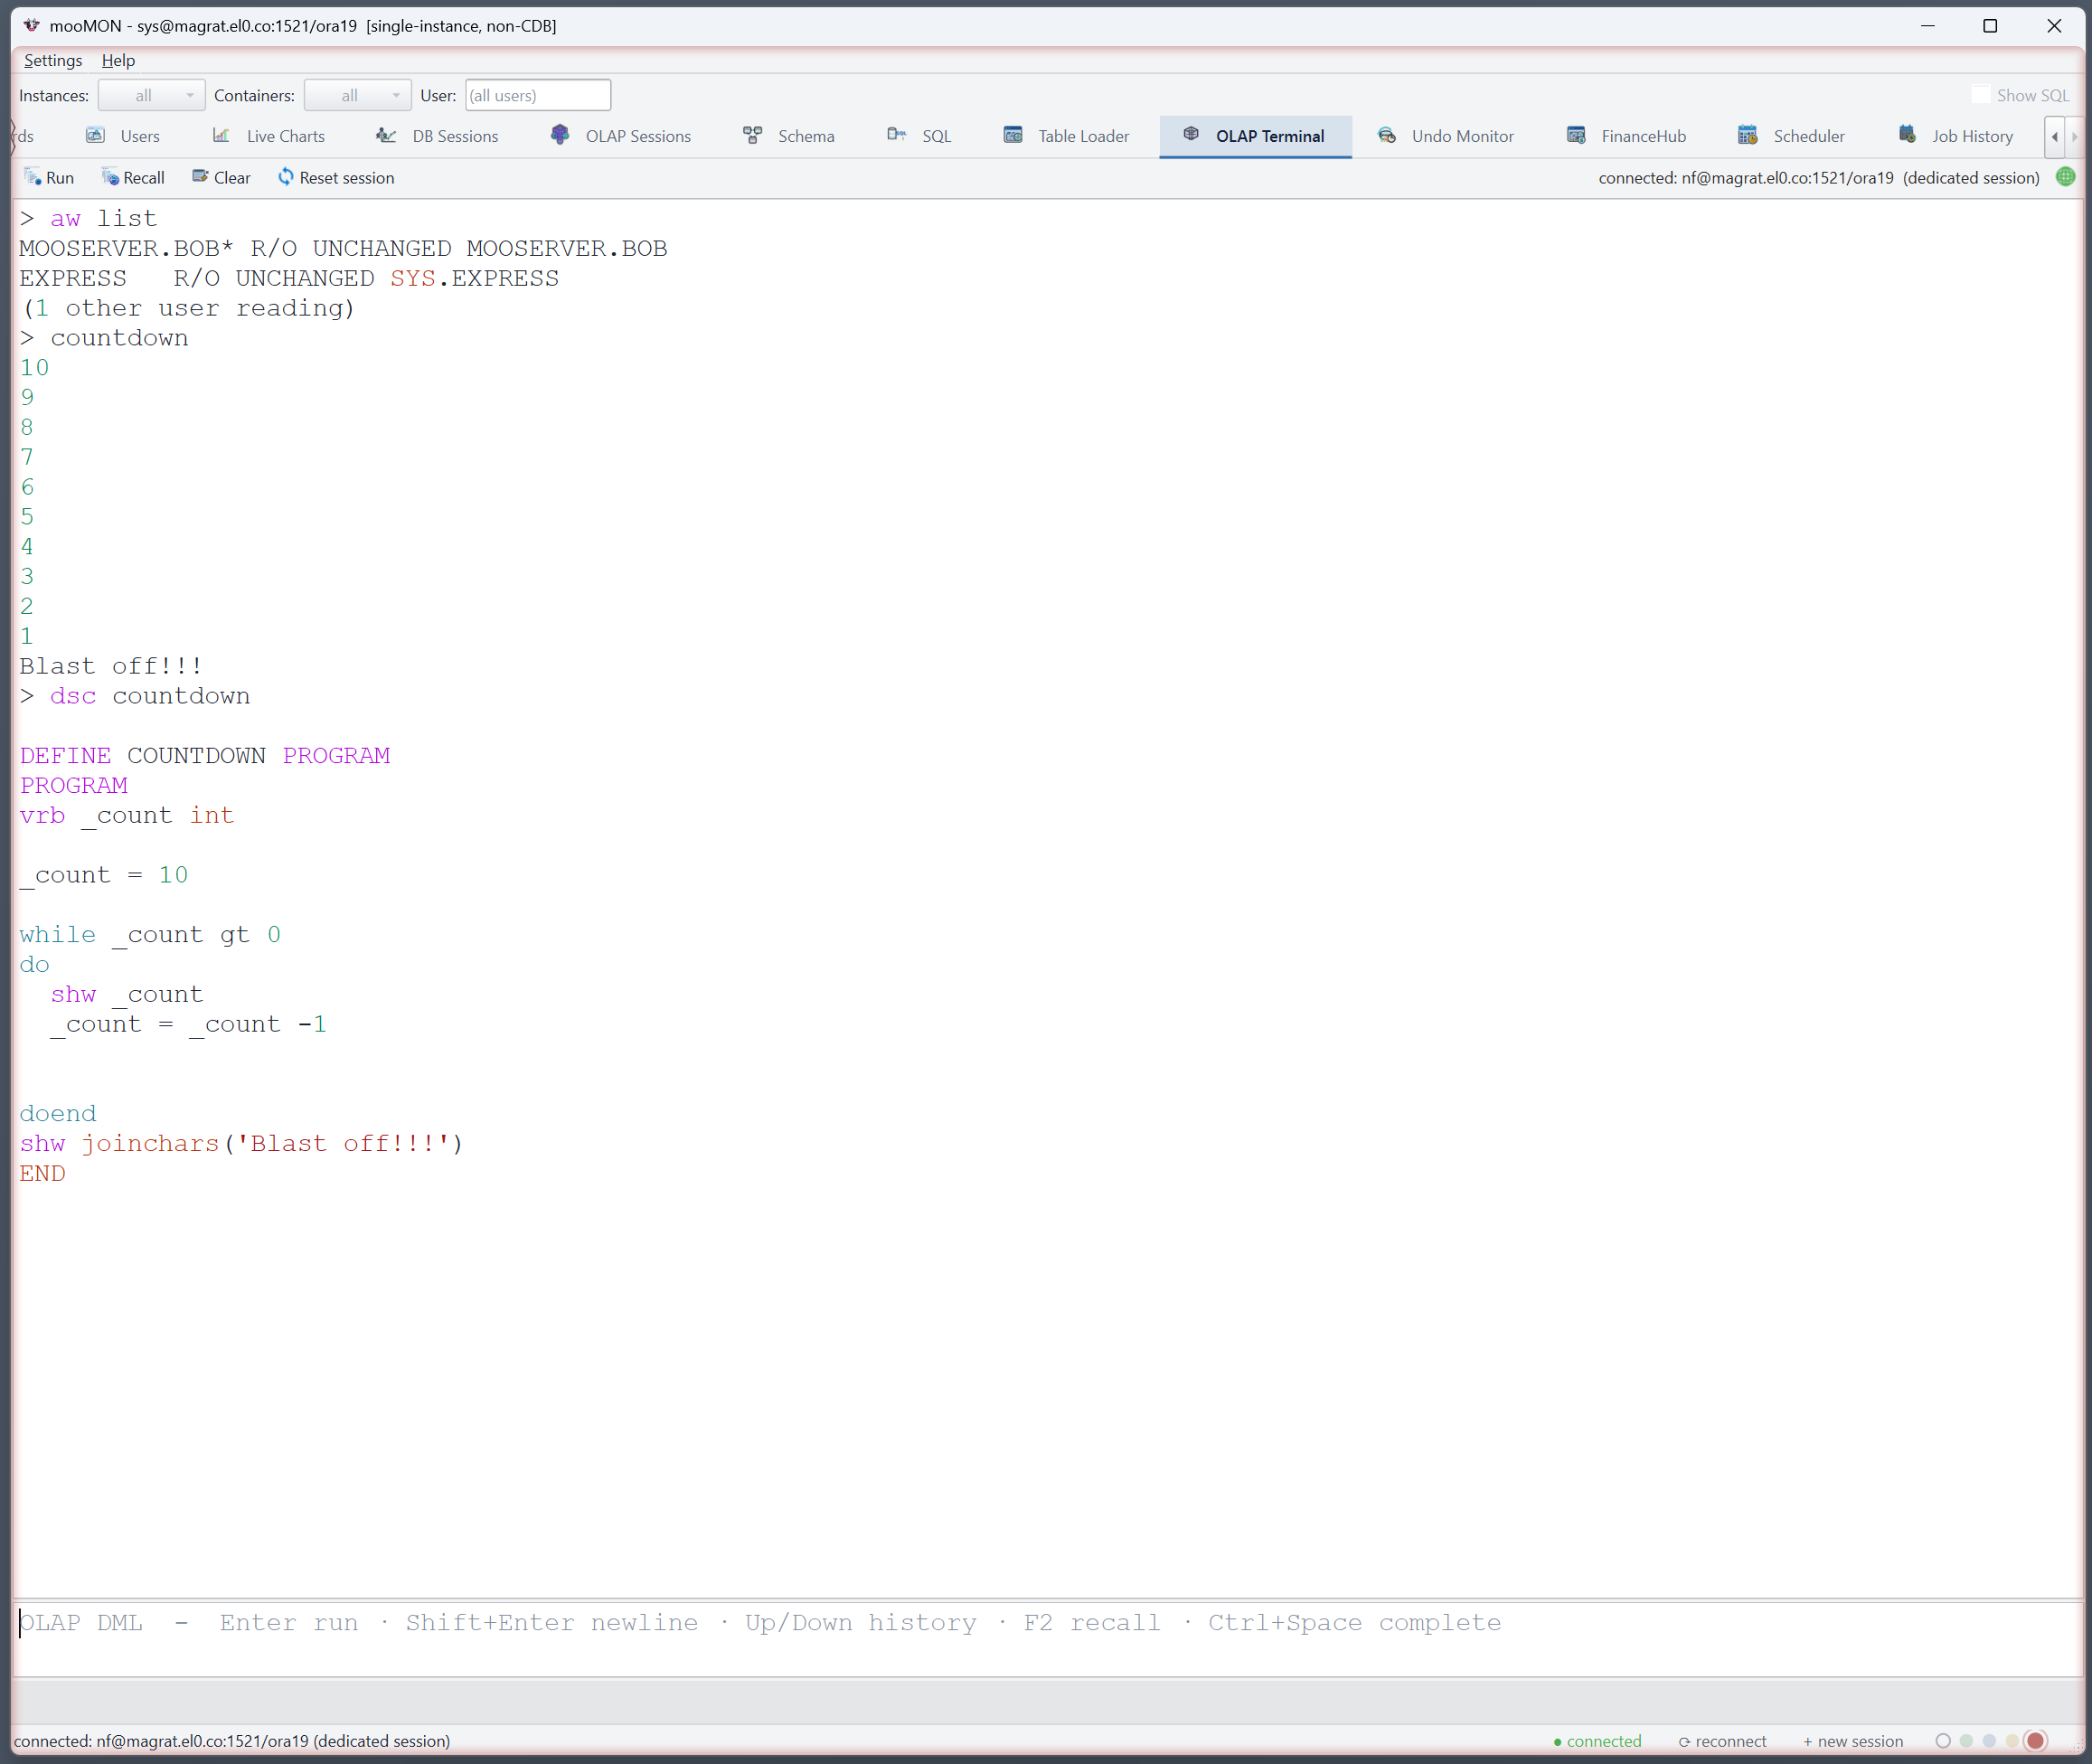
A dedicated terminal for Oracle OLAP / analytic-workspace work — run OLAP DML, read the log, and edit and compile programs, all against a dedicated session. Syntax highlighting, command recall and in-session editing make it a real working environment, and it recovers cleanly if a command is killed or a session drops.
Pseudo-commands
Beyond raw OLAP DML, the terminal understands a set of convenience commands — type
moo help to list them:
| Command | What it does |
|---|---|
| help / moo help | Show the list of pseudo-commands |
| all_aws | List every analytic workspace in the database |
| pdb / con_name | This session's container (PDB / CDB$ROOT) and user |
| detach_all | Detach every attached AW (EXPRESS is never detached) |
| connect | (Re)open the session and start OLAP (dbms_aw.startup) |
| exit | Shut OLAP down and disconnect (dbms_aw.shutdown) |
| cls / clear | Clear the transcript |
| tbl <rpr args> | Run a report and open it as a table (copy / Excel / CSV) |
| lotf <path> / lotf off | Tee command output to a file (log output to file) |
| edt <name> | Edit a program, model or aggmap |
| edtv <name> | Edit a text variable |
| <cmd> | mgrep <pat> | Filter a command's output to matching lines |
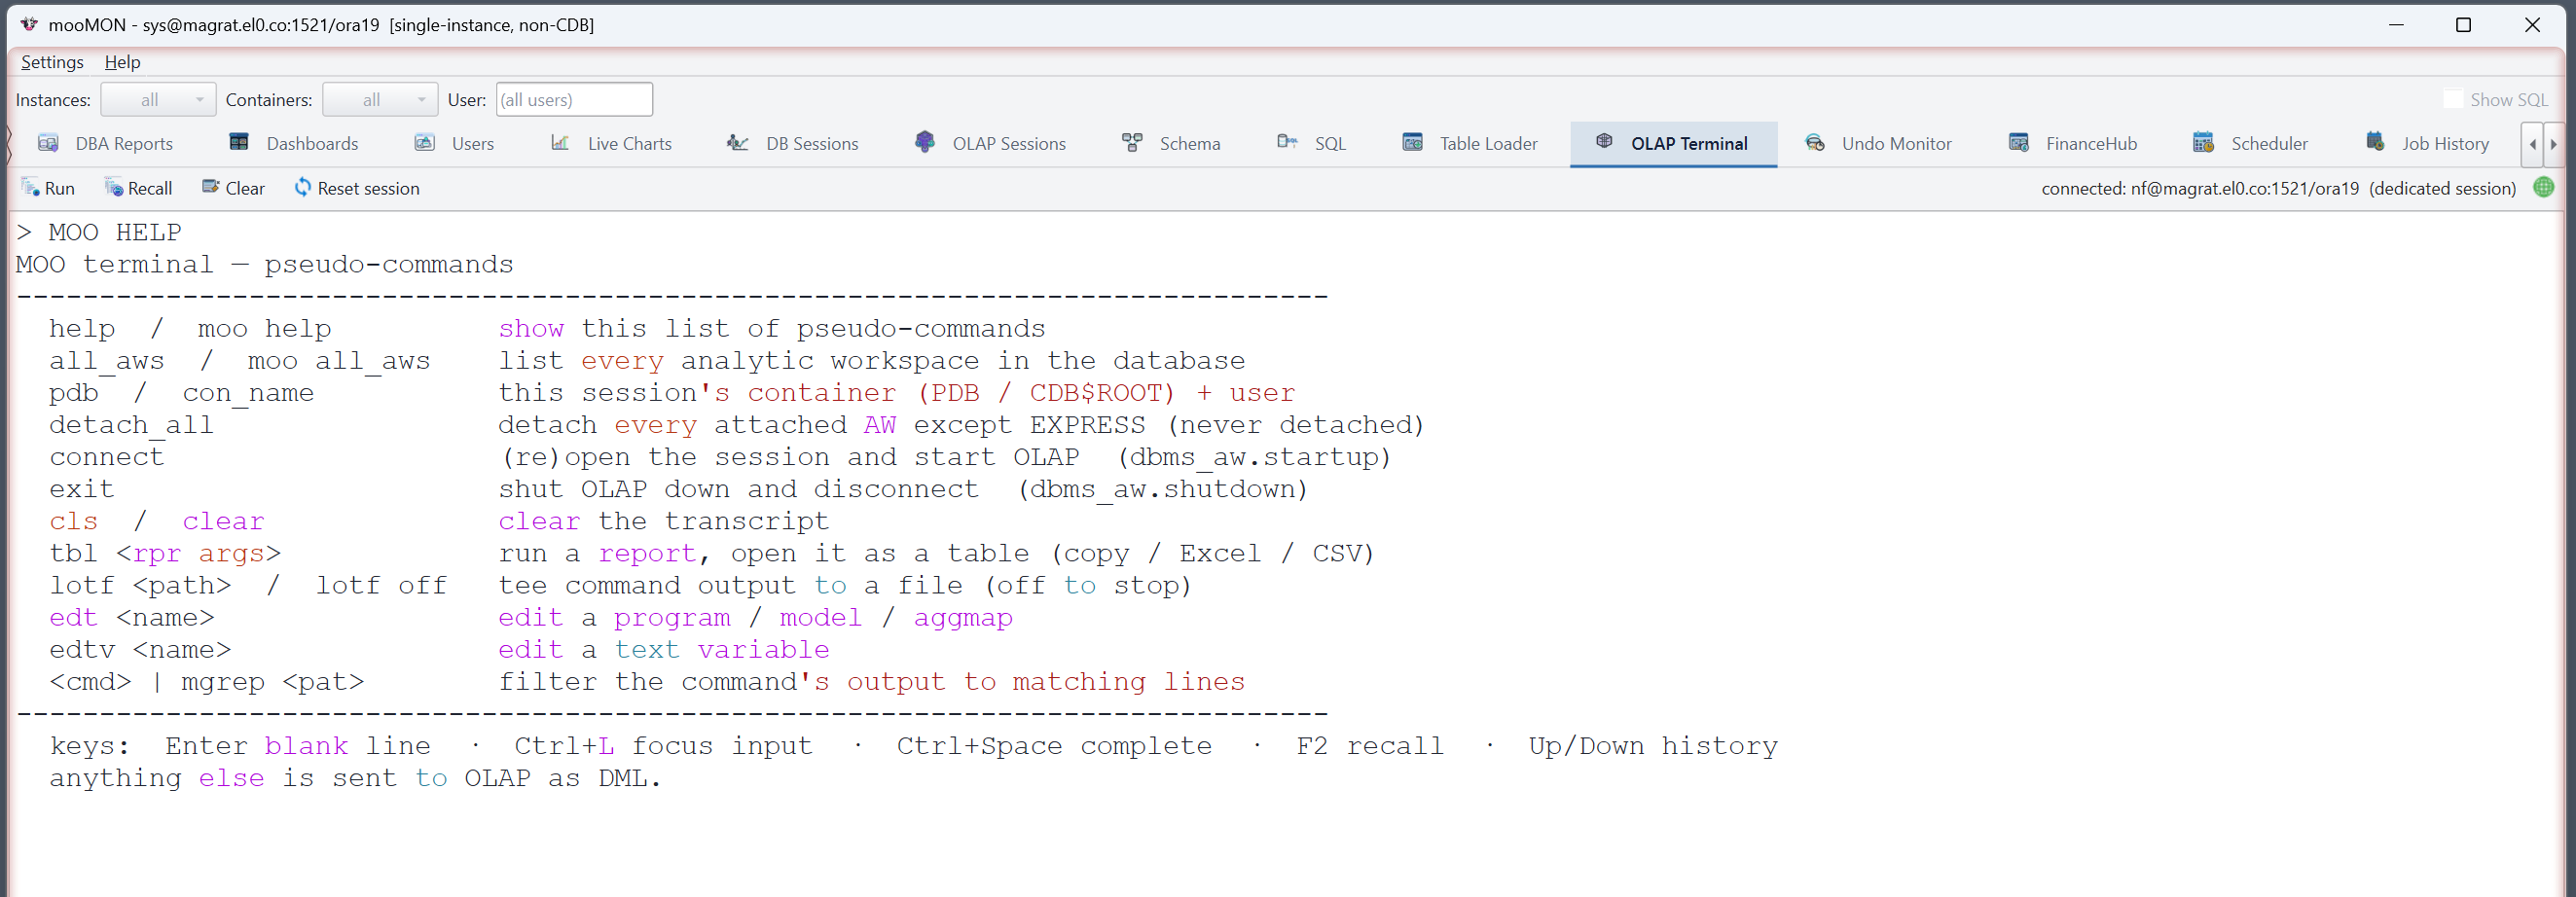
moo help lists the pseudo-commands in the transcript.Completion & output filtering
Press Ctrl+Space for OLAP DML completion, with one-line syntax help drawn
from the built-in lexicon. Pipe any command through mgrep to filter a long report
down to the lines you care about.

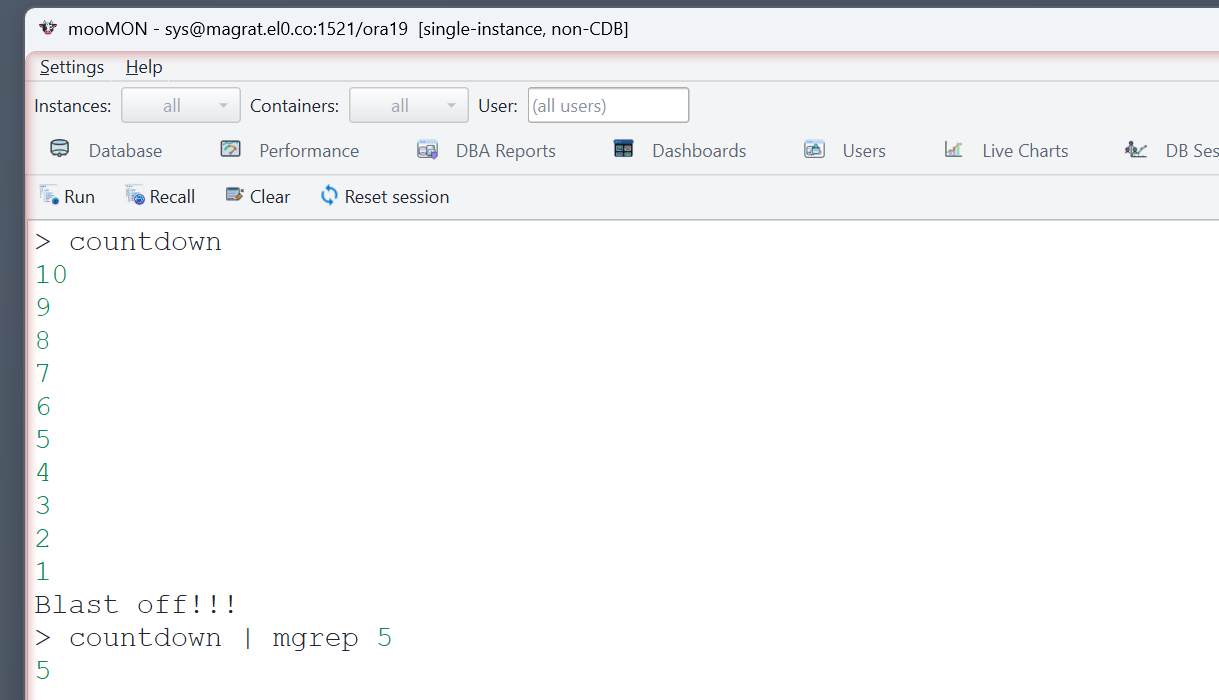
mgrep.Programs & sessions
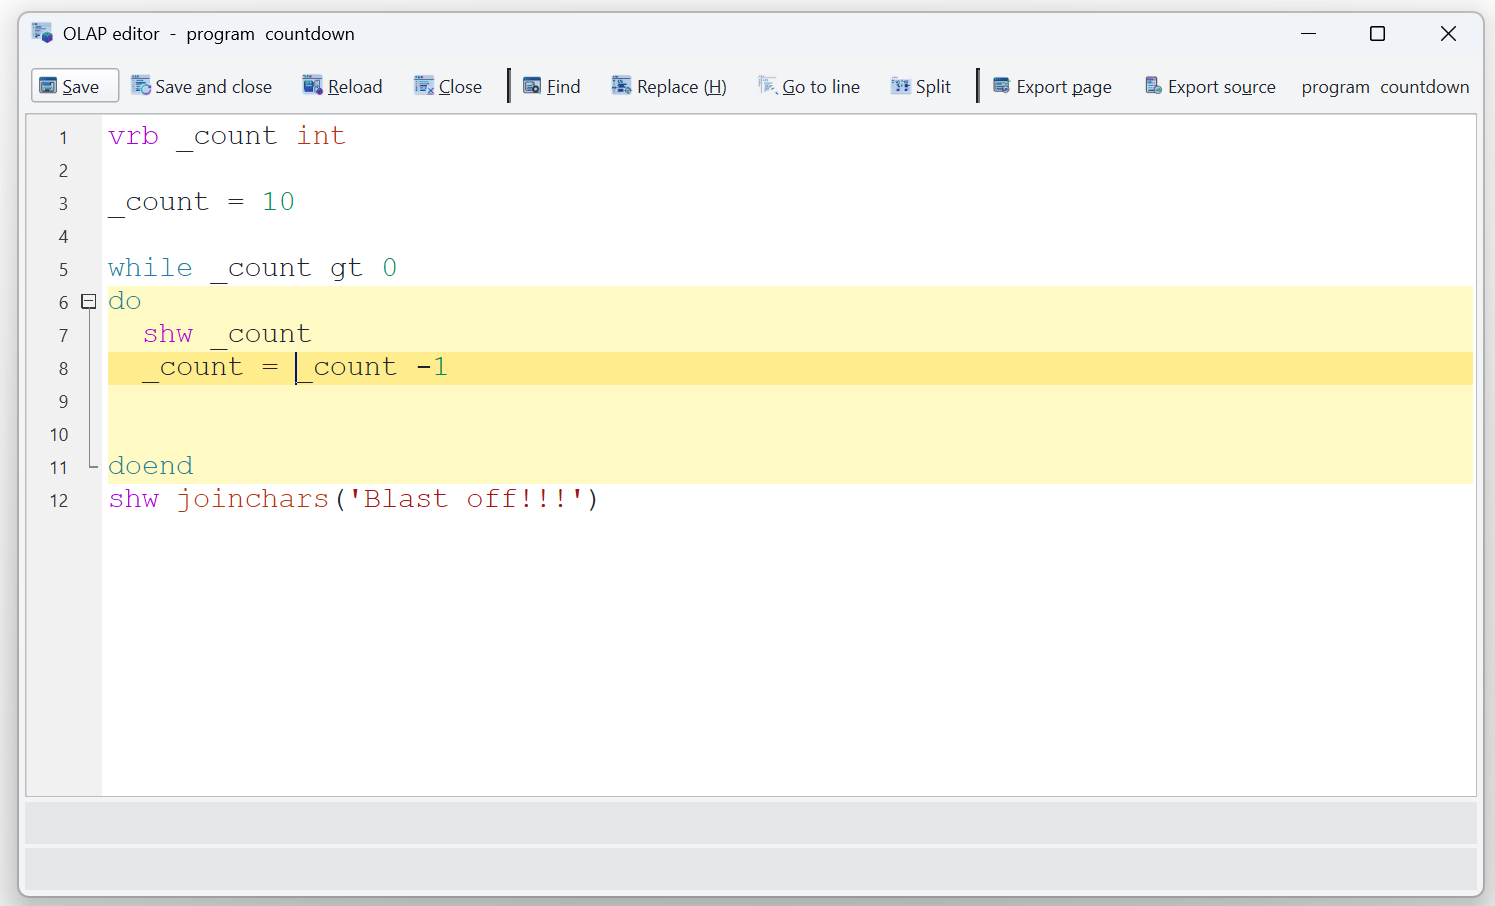
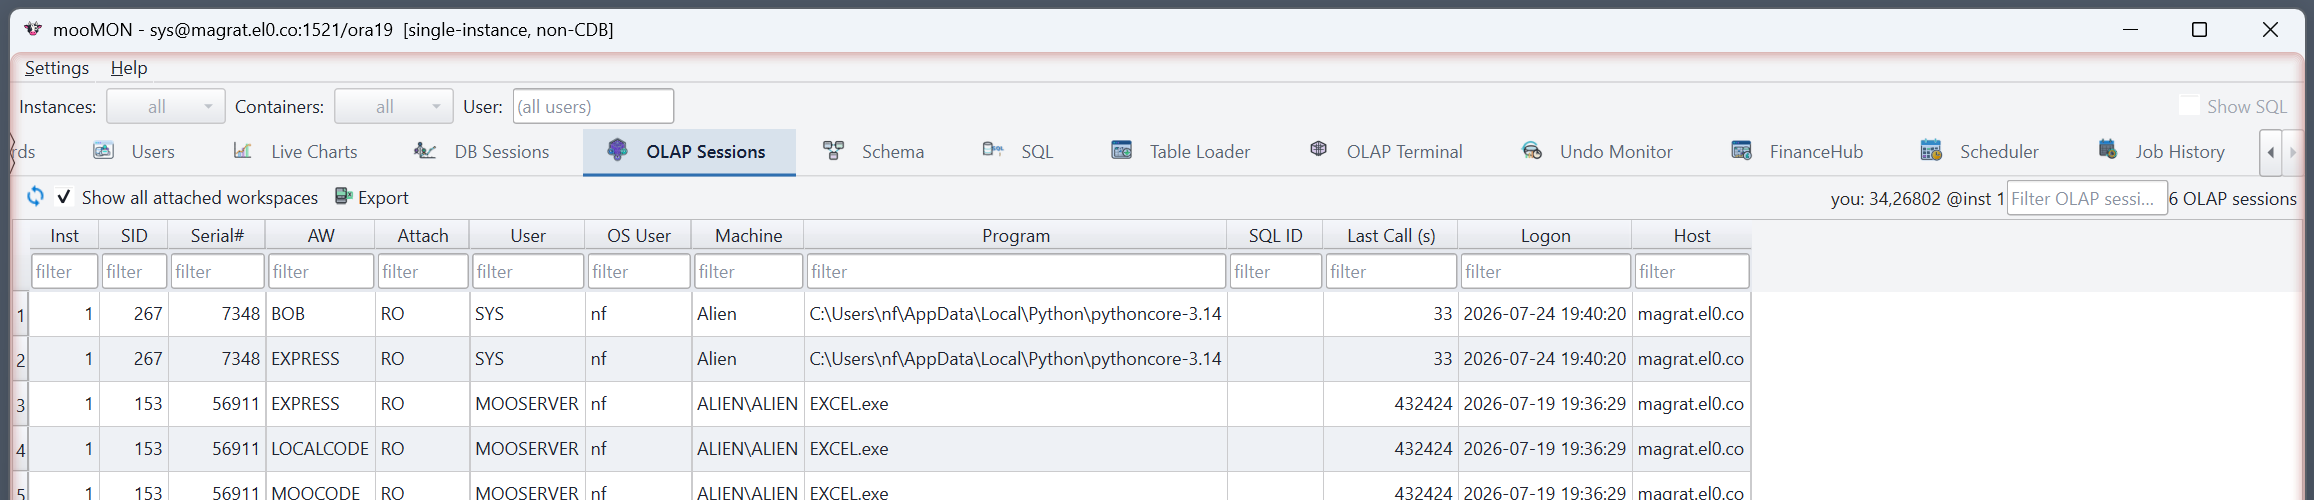
Edit OLAP programs with highlighting, and keep an eye on which sessions have an analytic workspace attached — with the same safe kill controls as the database session manager.
Container switcher
On a multitenant database, the session-container picker in the top bar lets you act inside a PDB straight from the CDB root — schema, SQL, Table Loader and OLAP all follow the container you choose, so a grant or a load lands where you intend.
The FinanceHub module
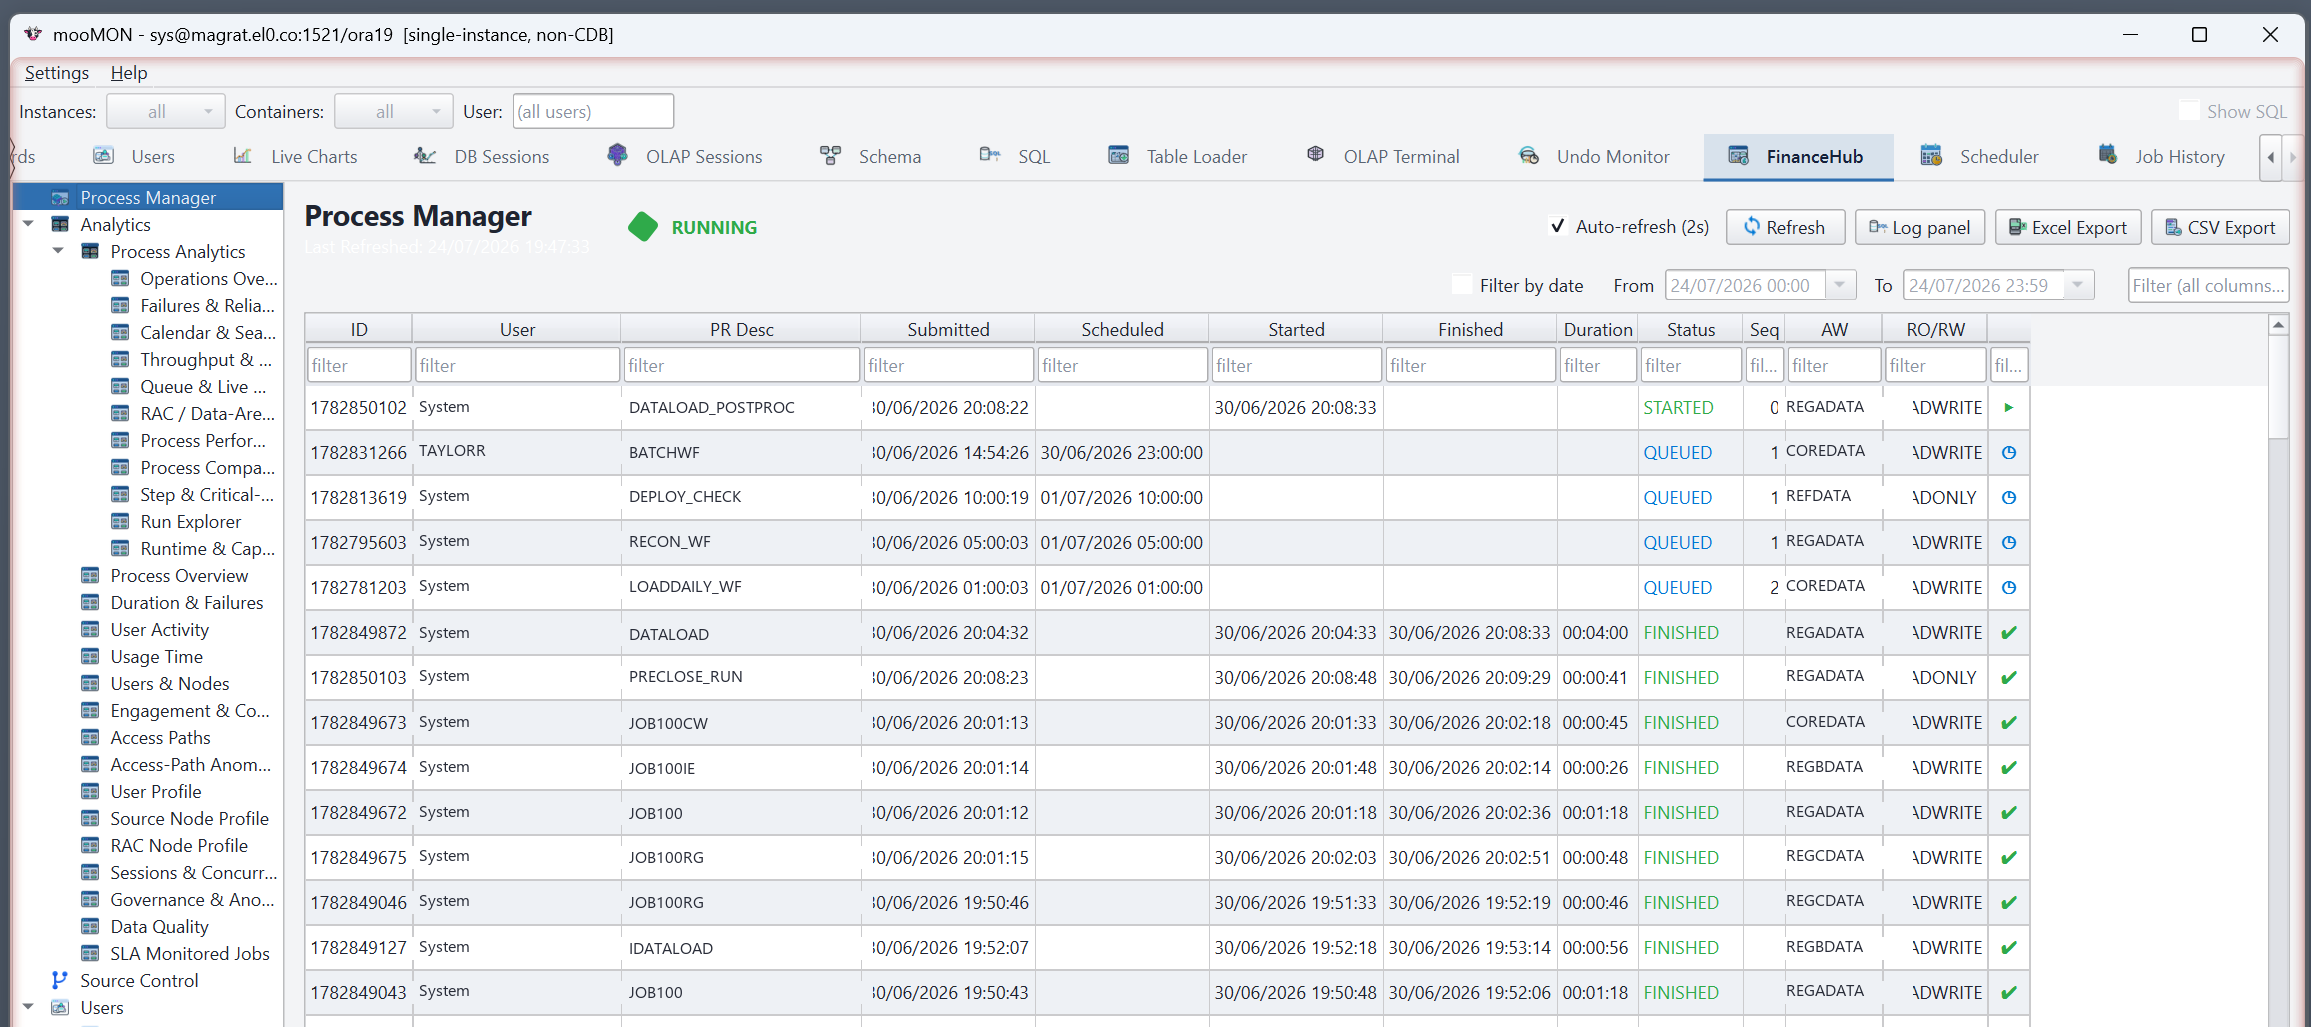
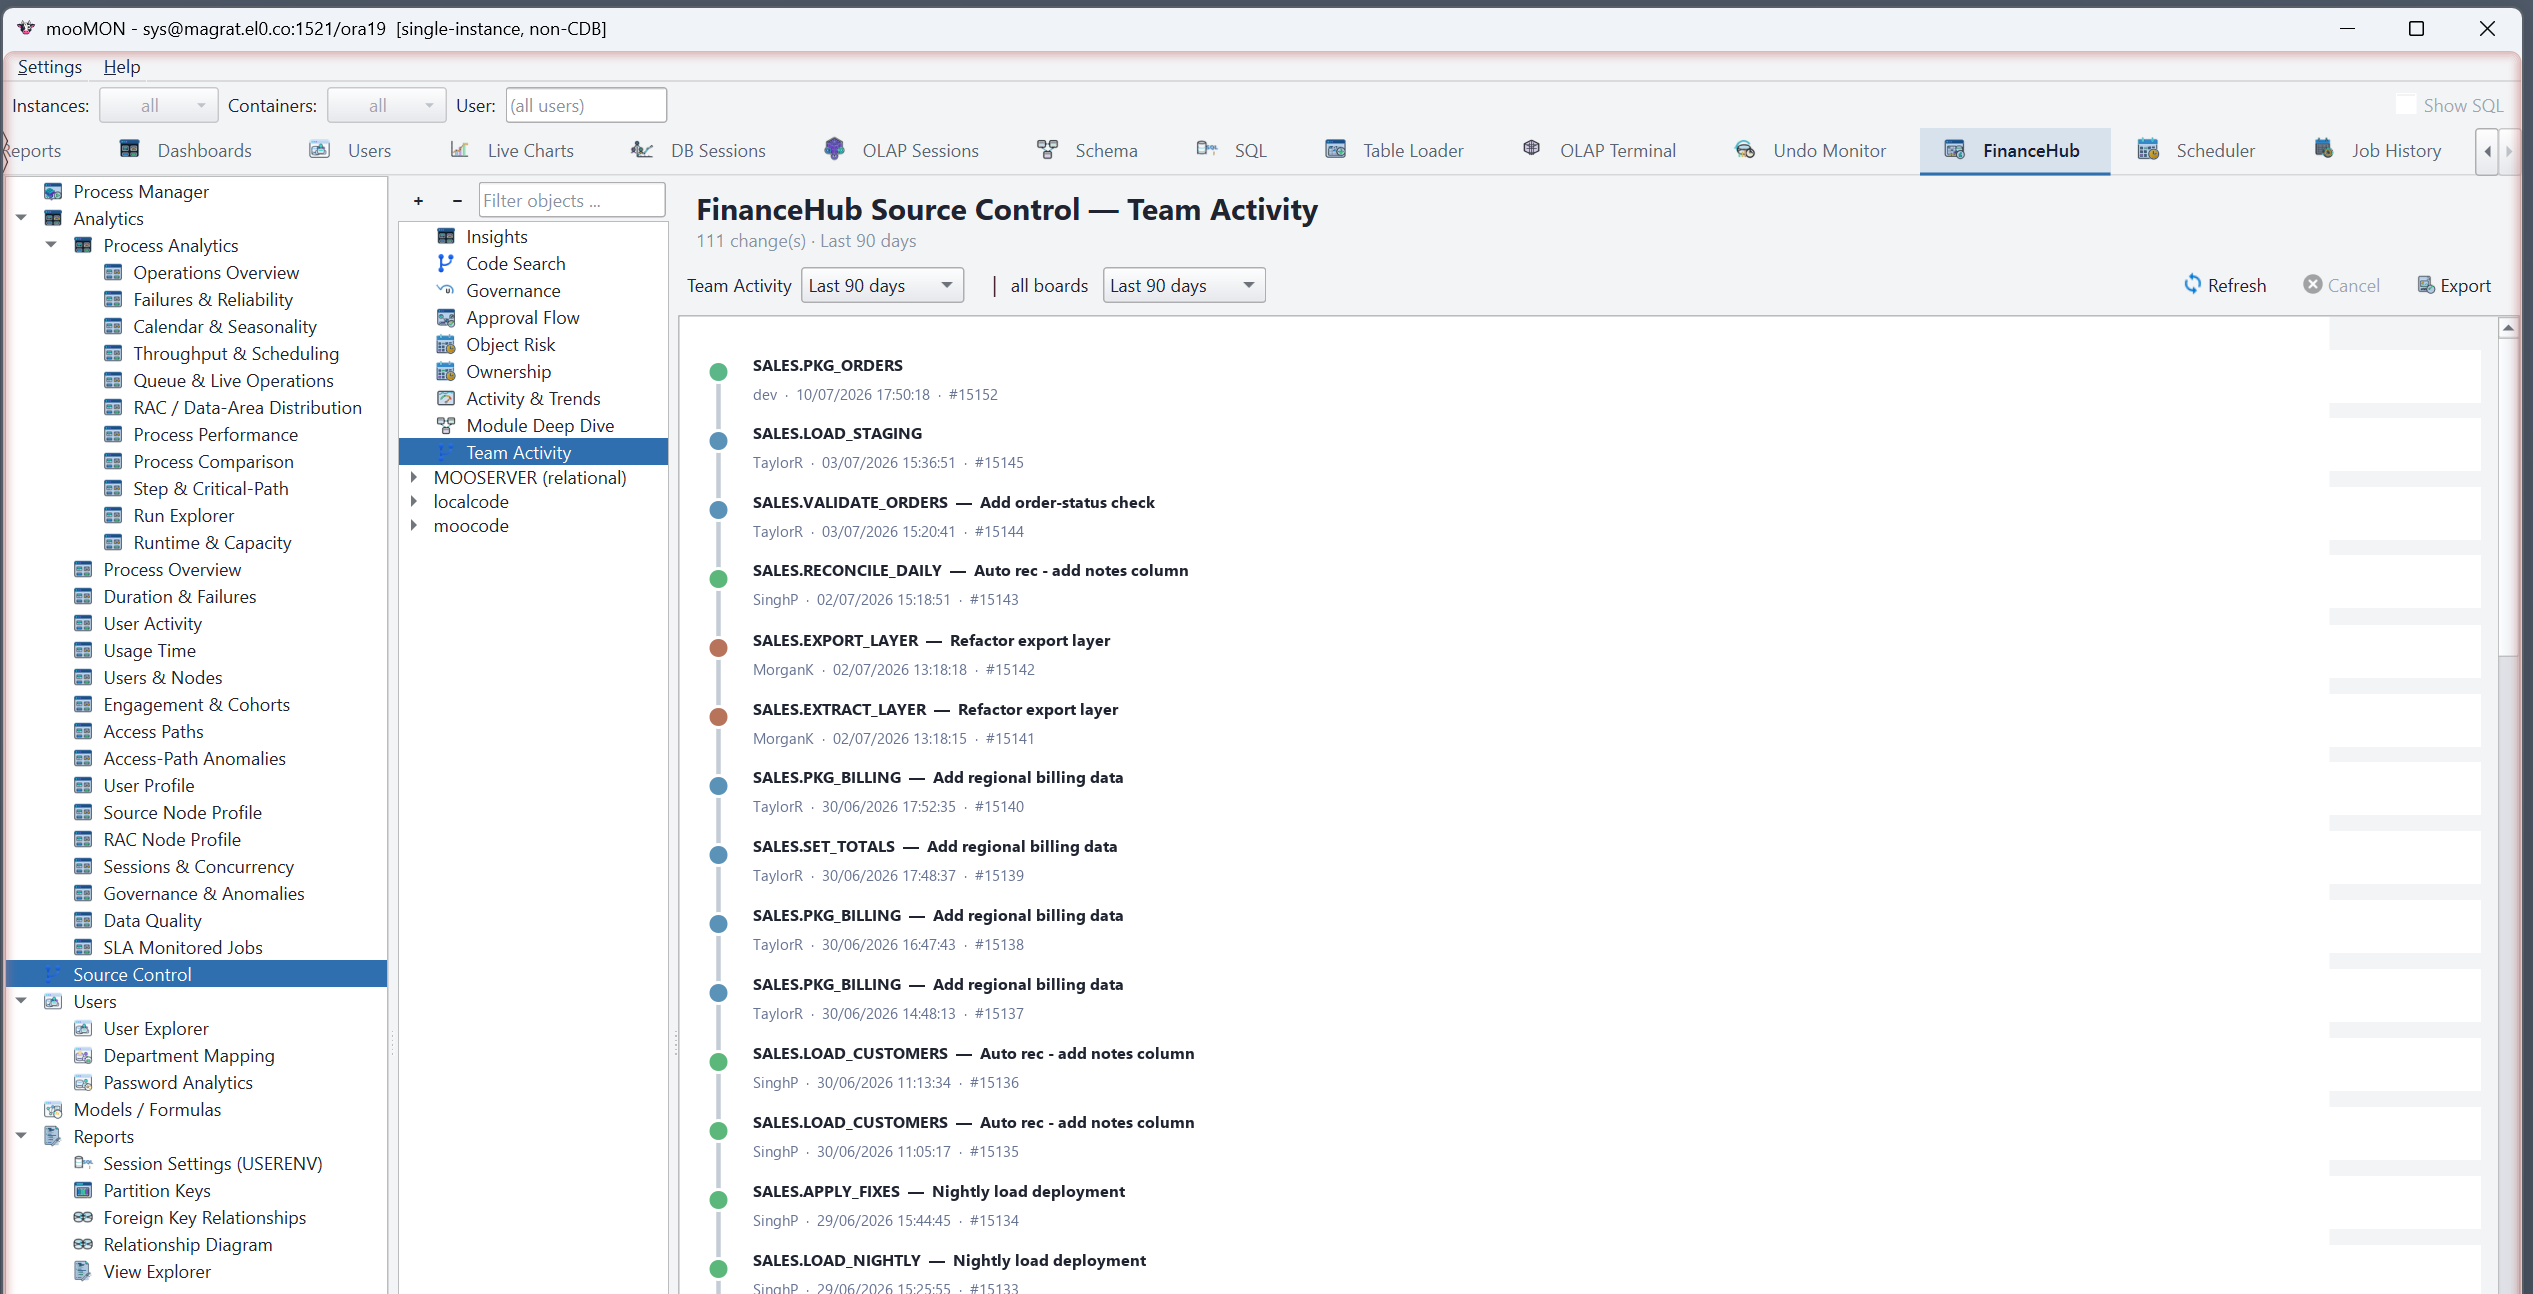
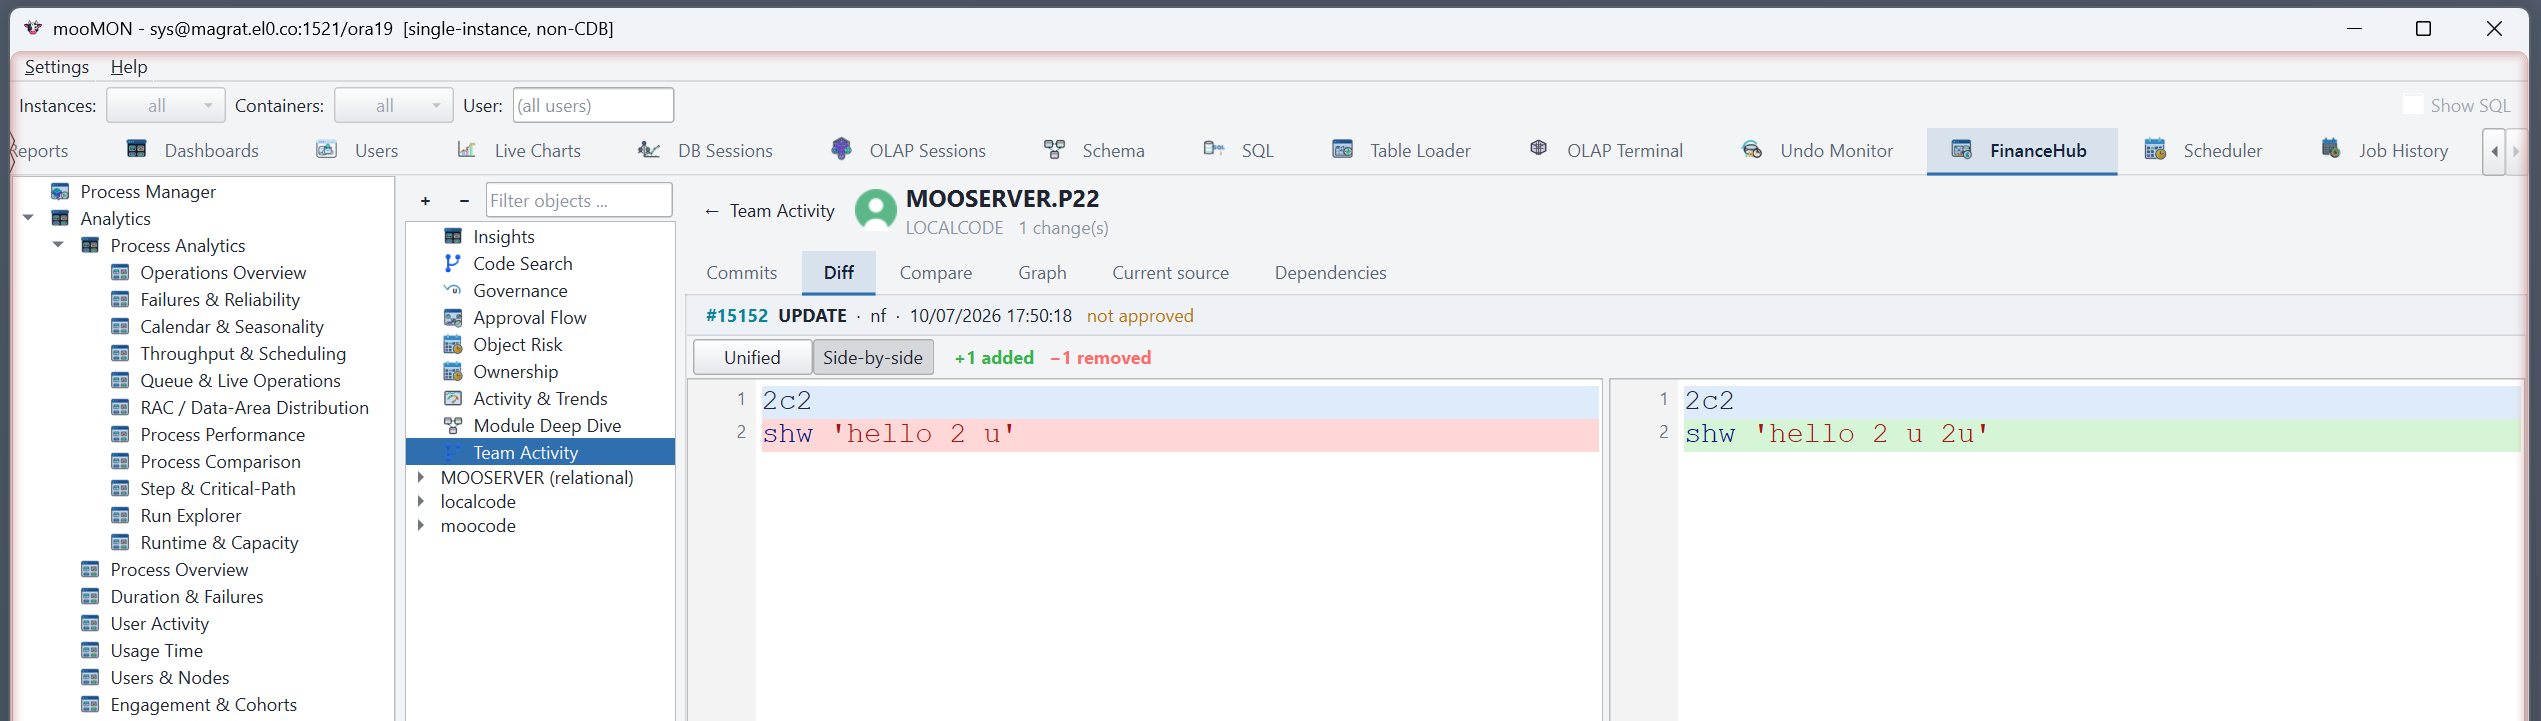
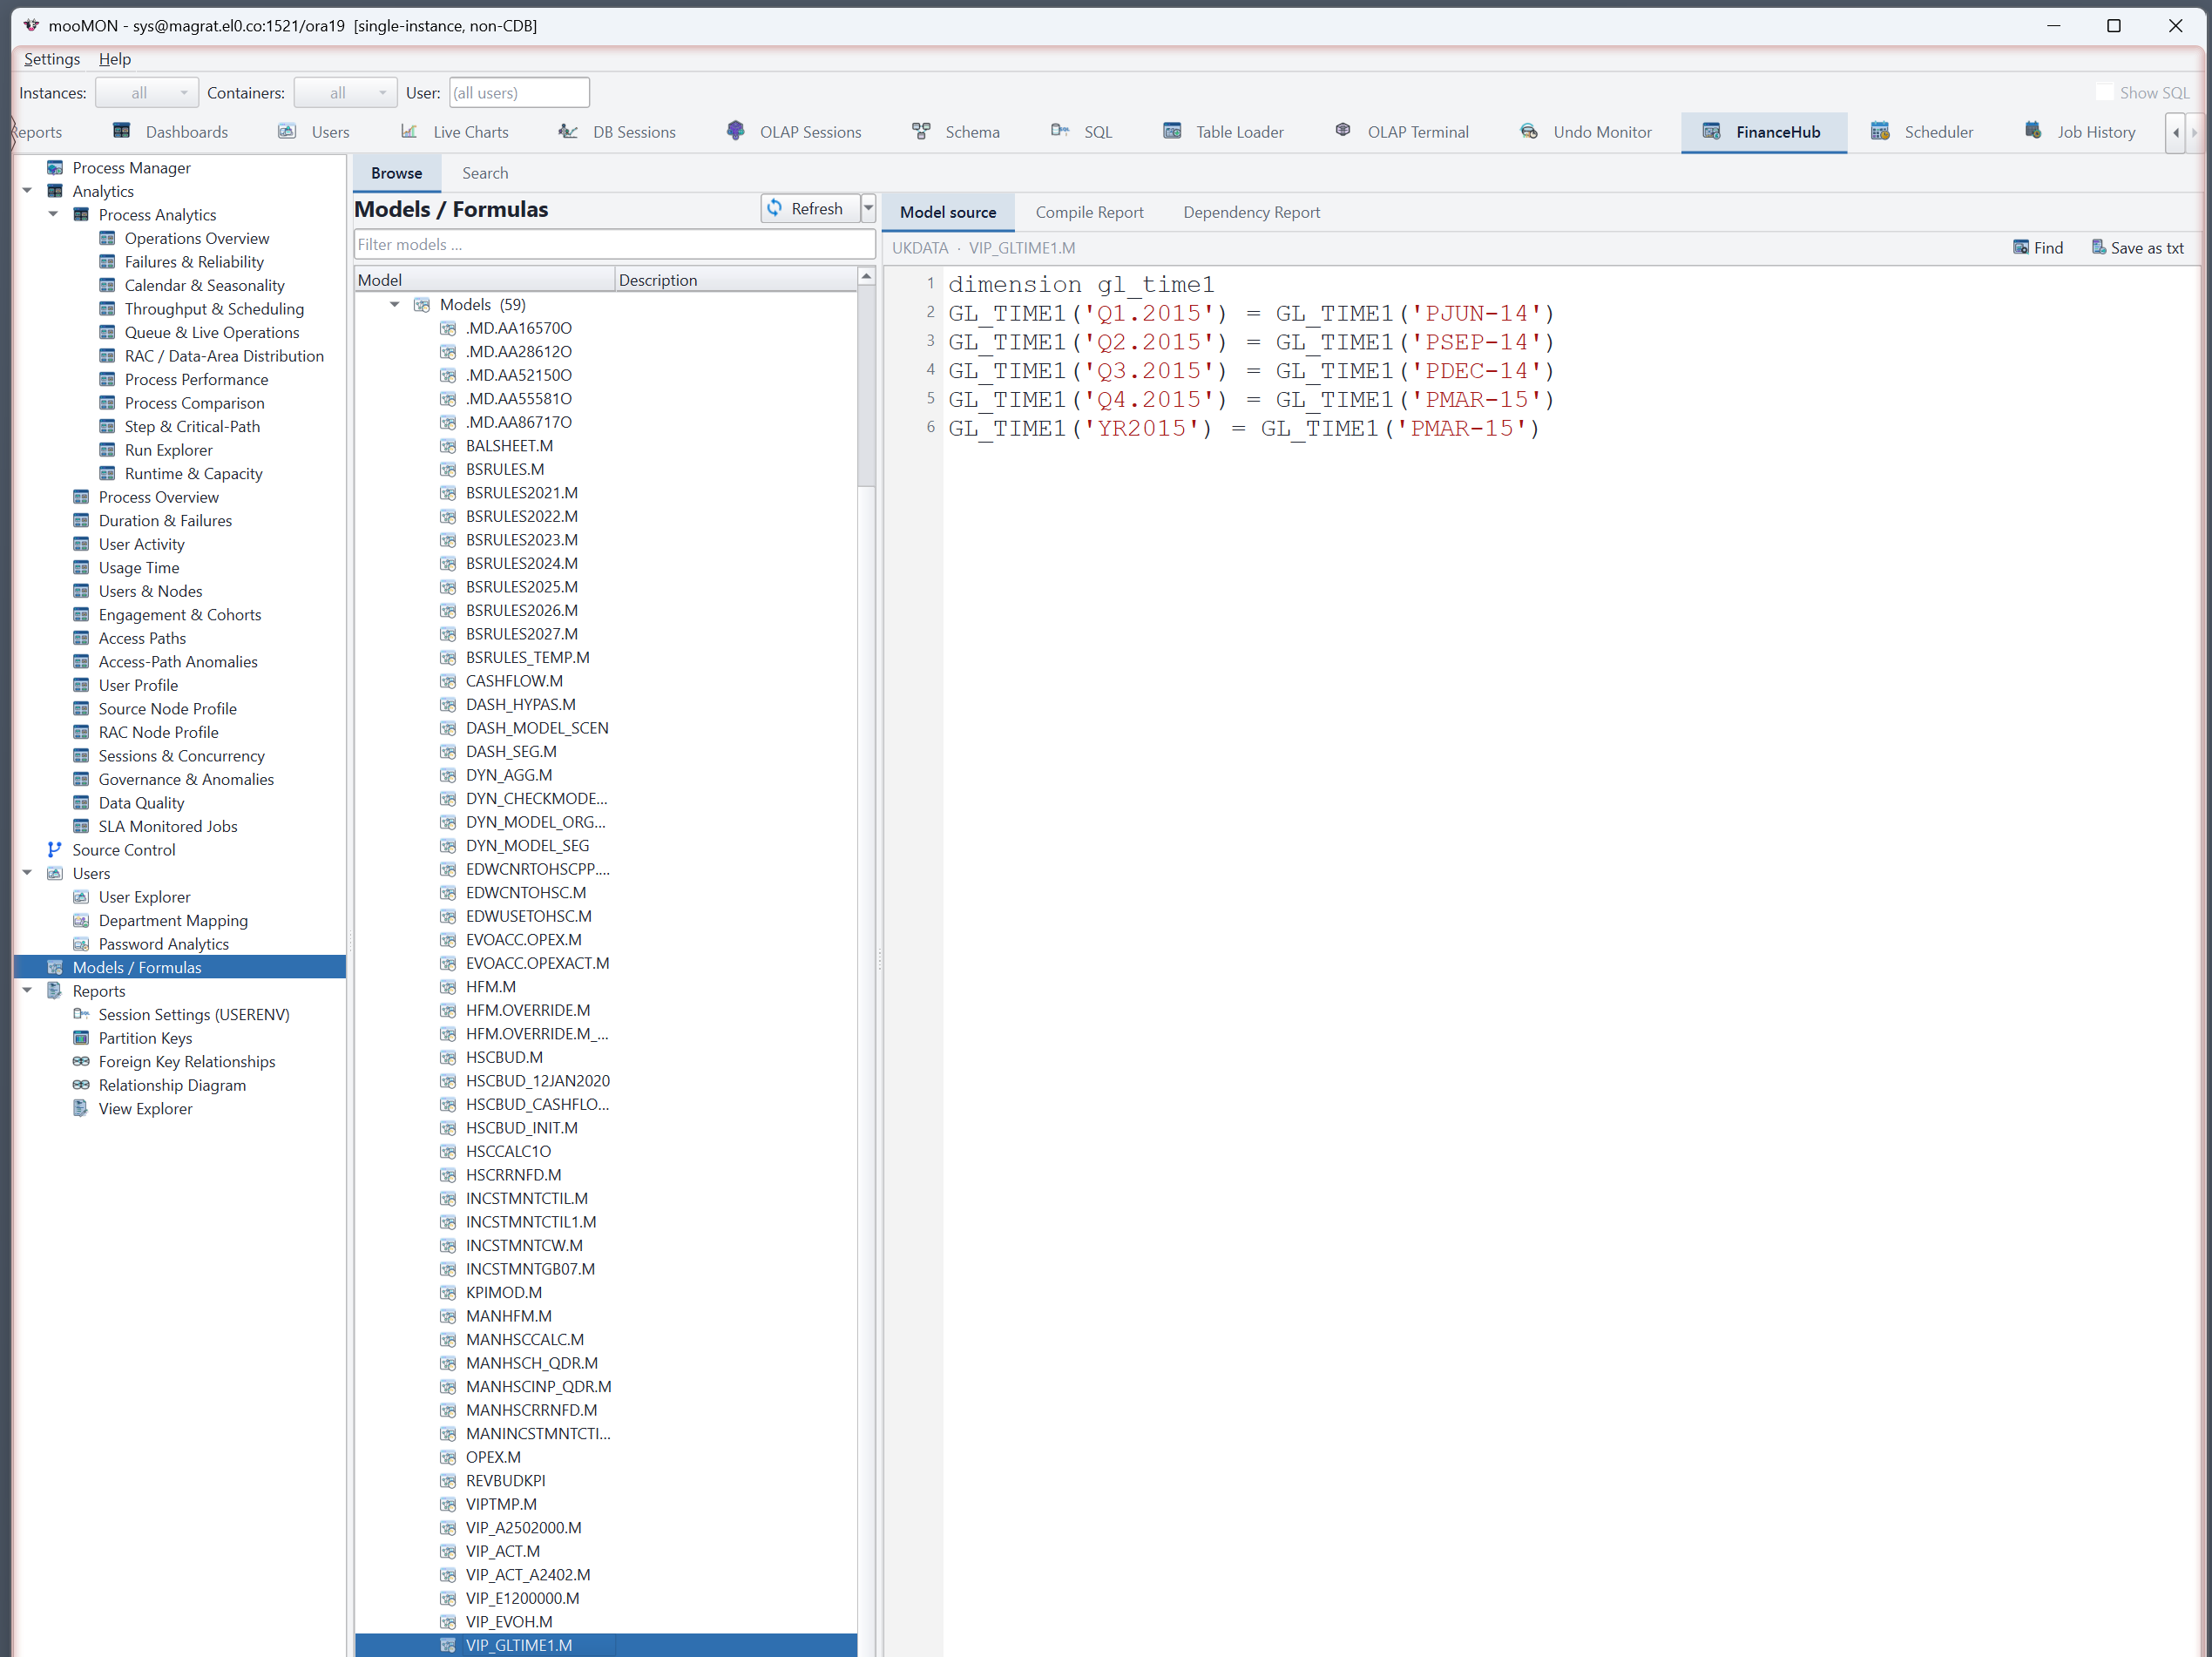
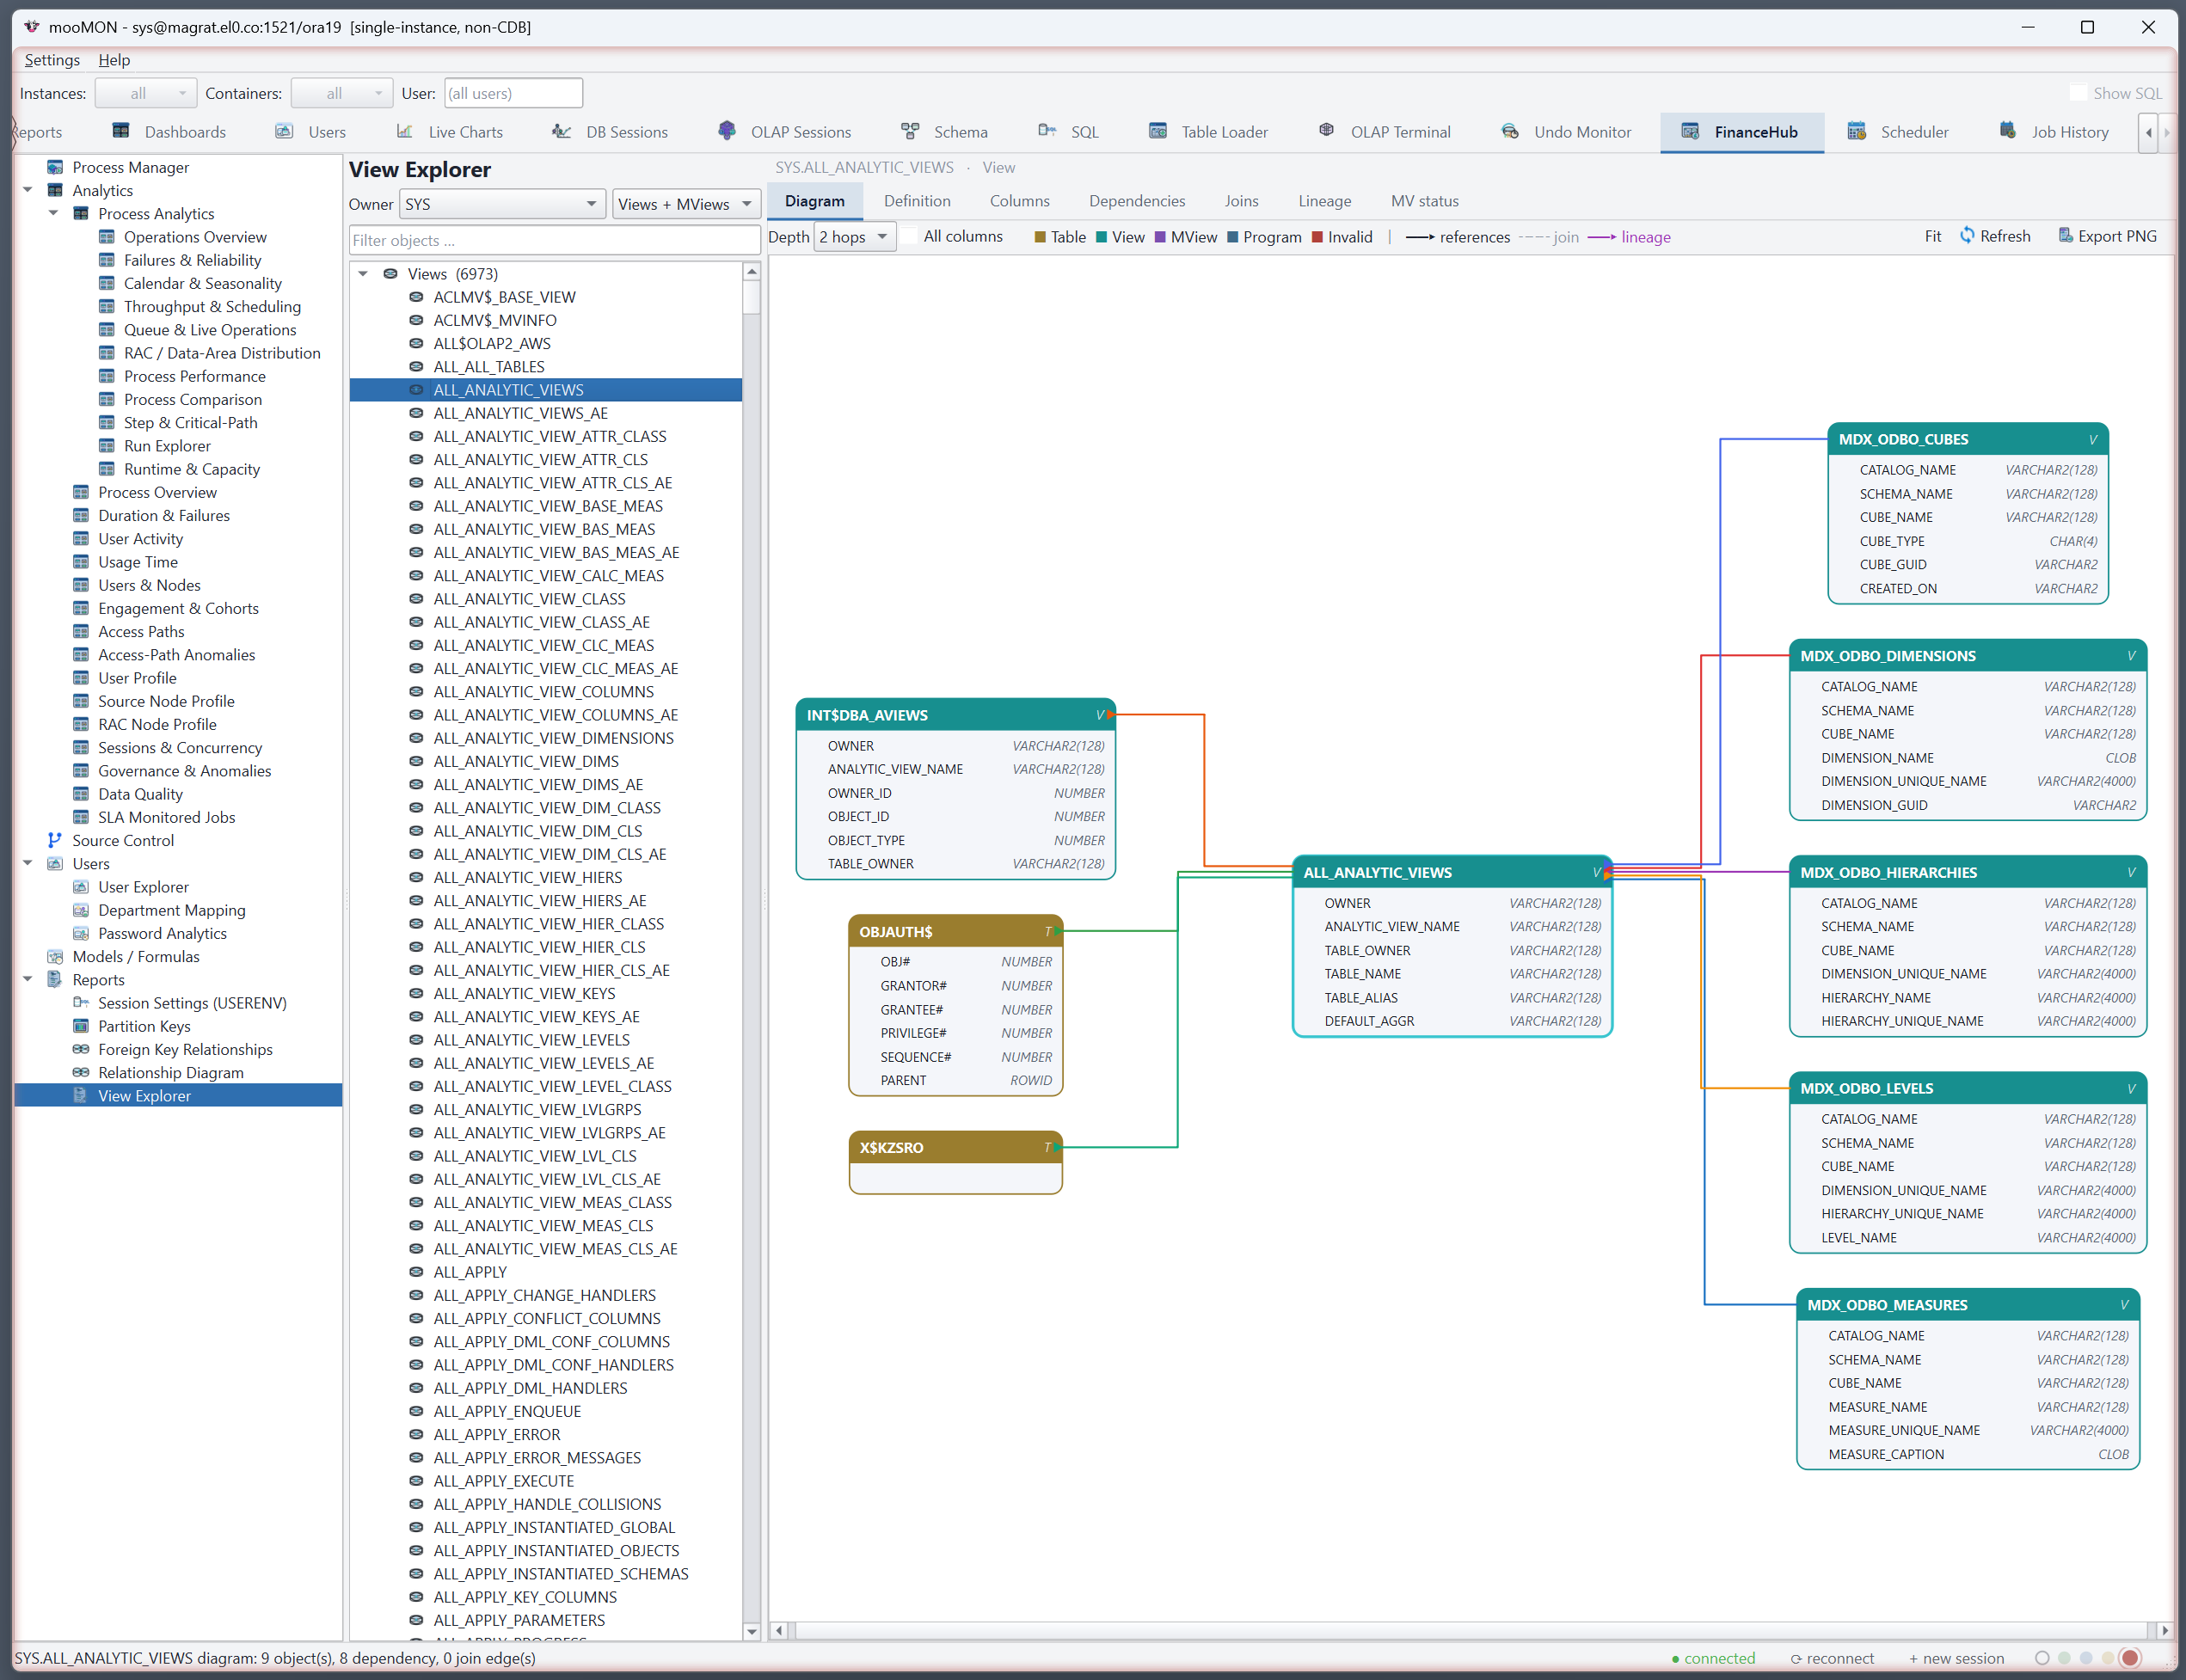
Where licensed, mooMON includes a FinanceHub module for teams running the FinanceHub platform: a Process Manager over the OLAP process table with a live run-state view; a GitLab-style Source Control browser with commits, diffs and history; a Models / Formulas browser; a View Explorer with dependency diagrams; and a Password Analytics board.
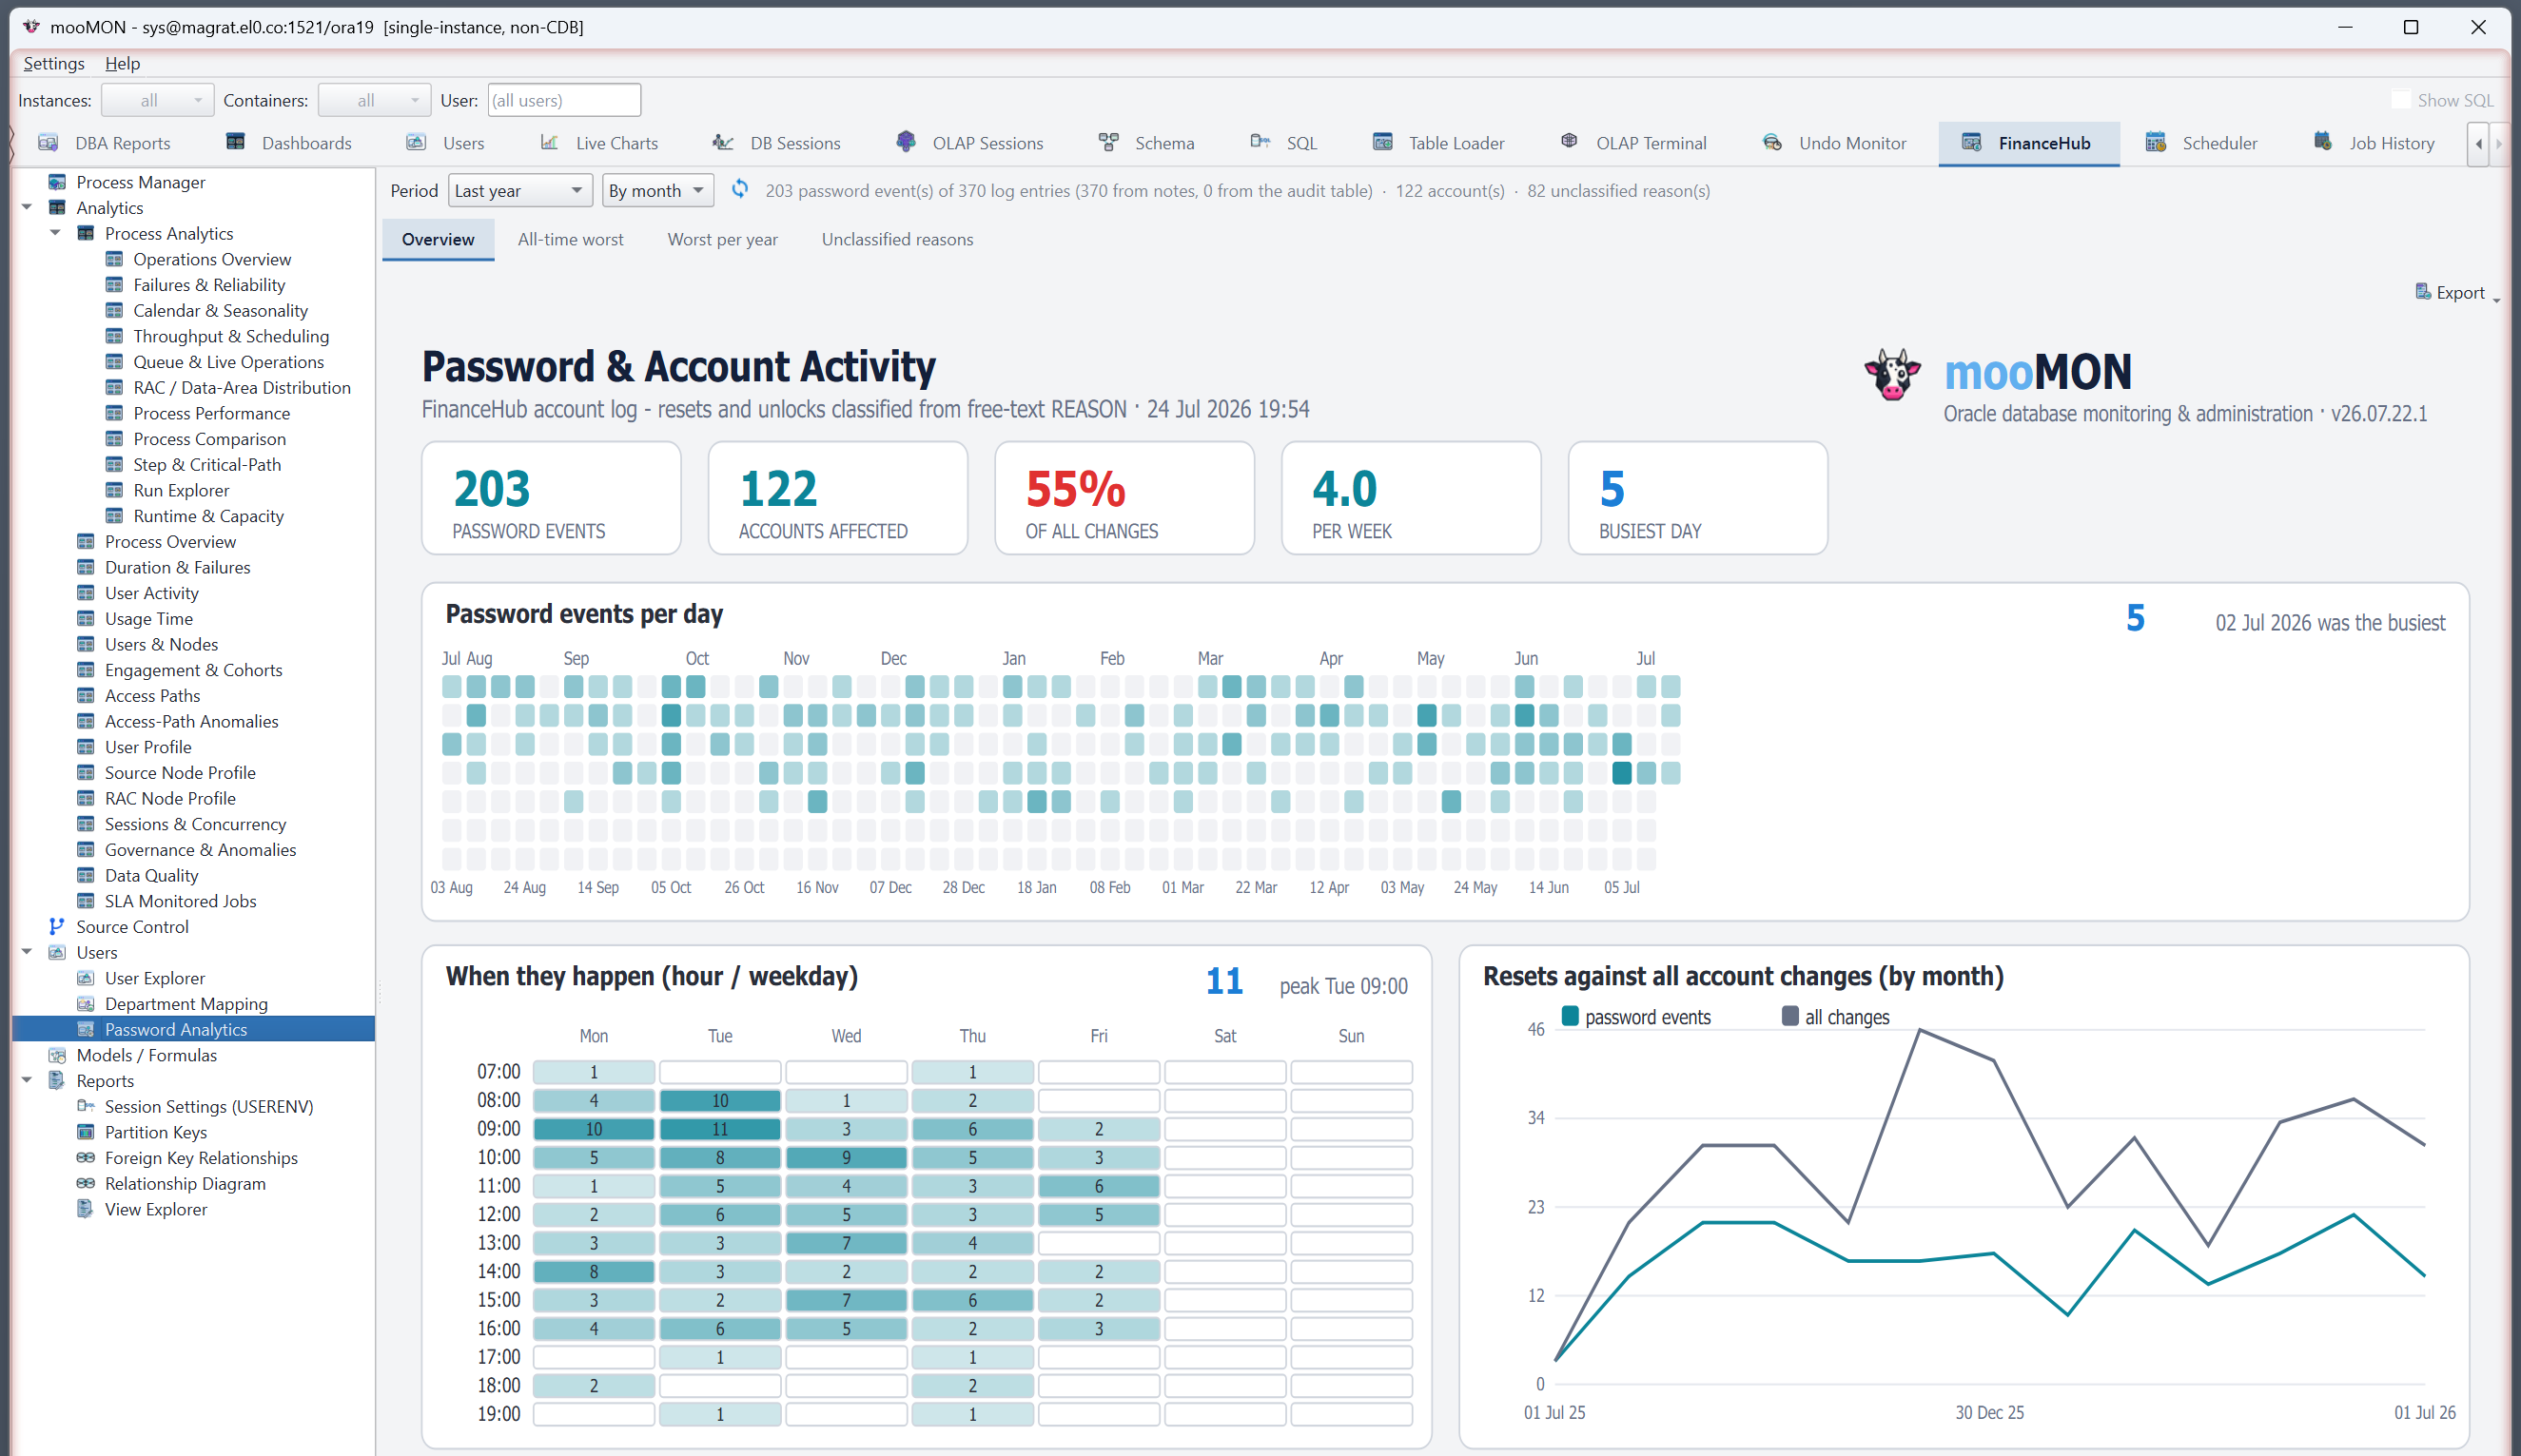
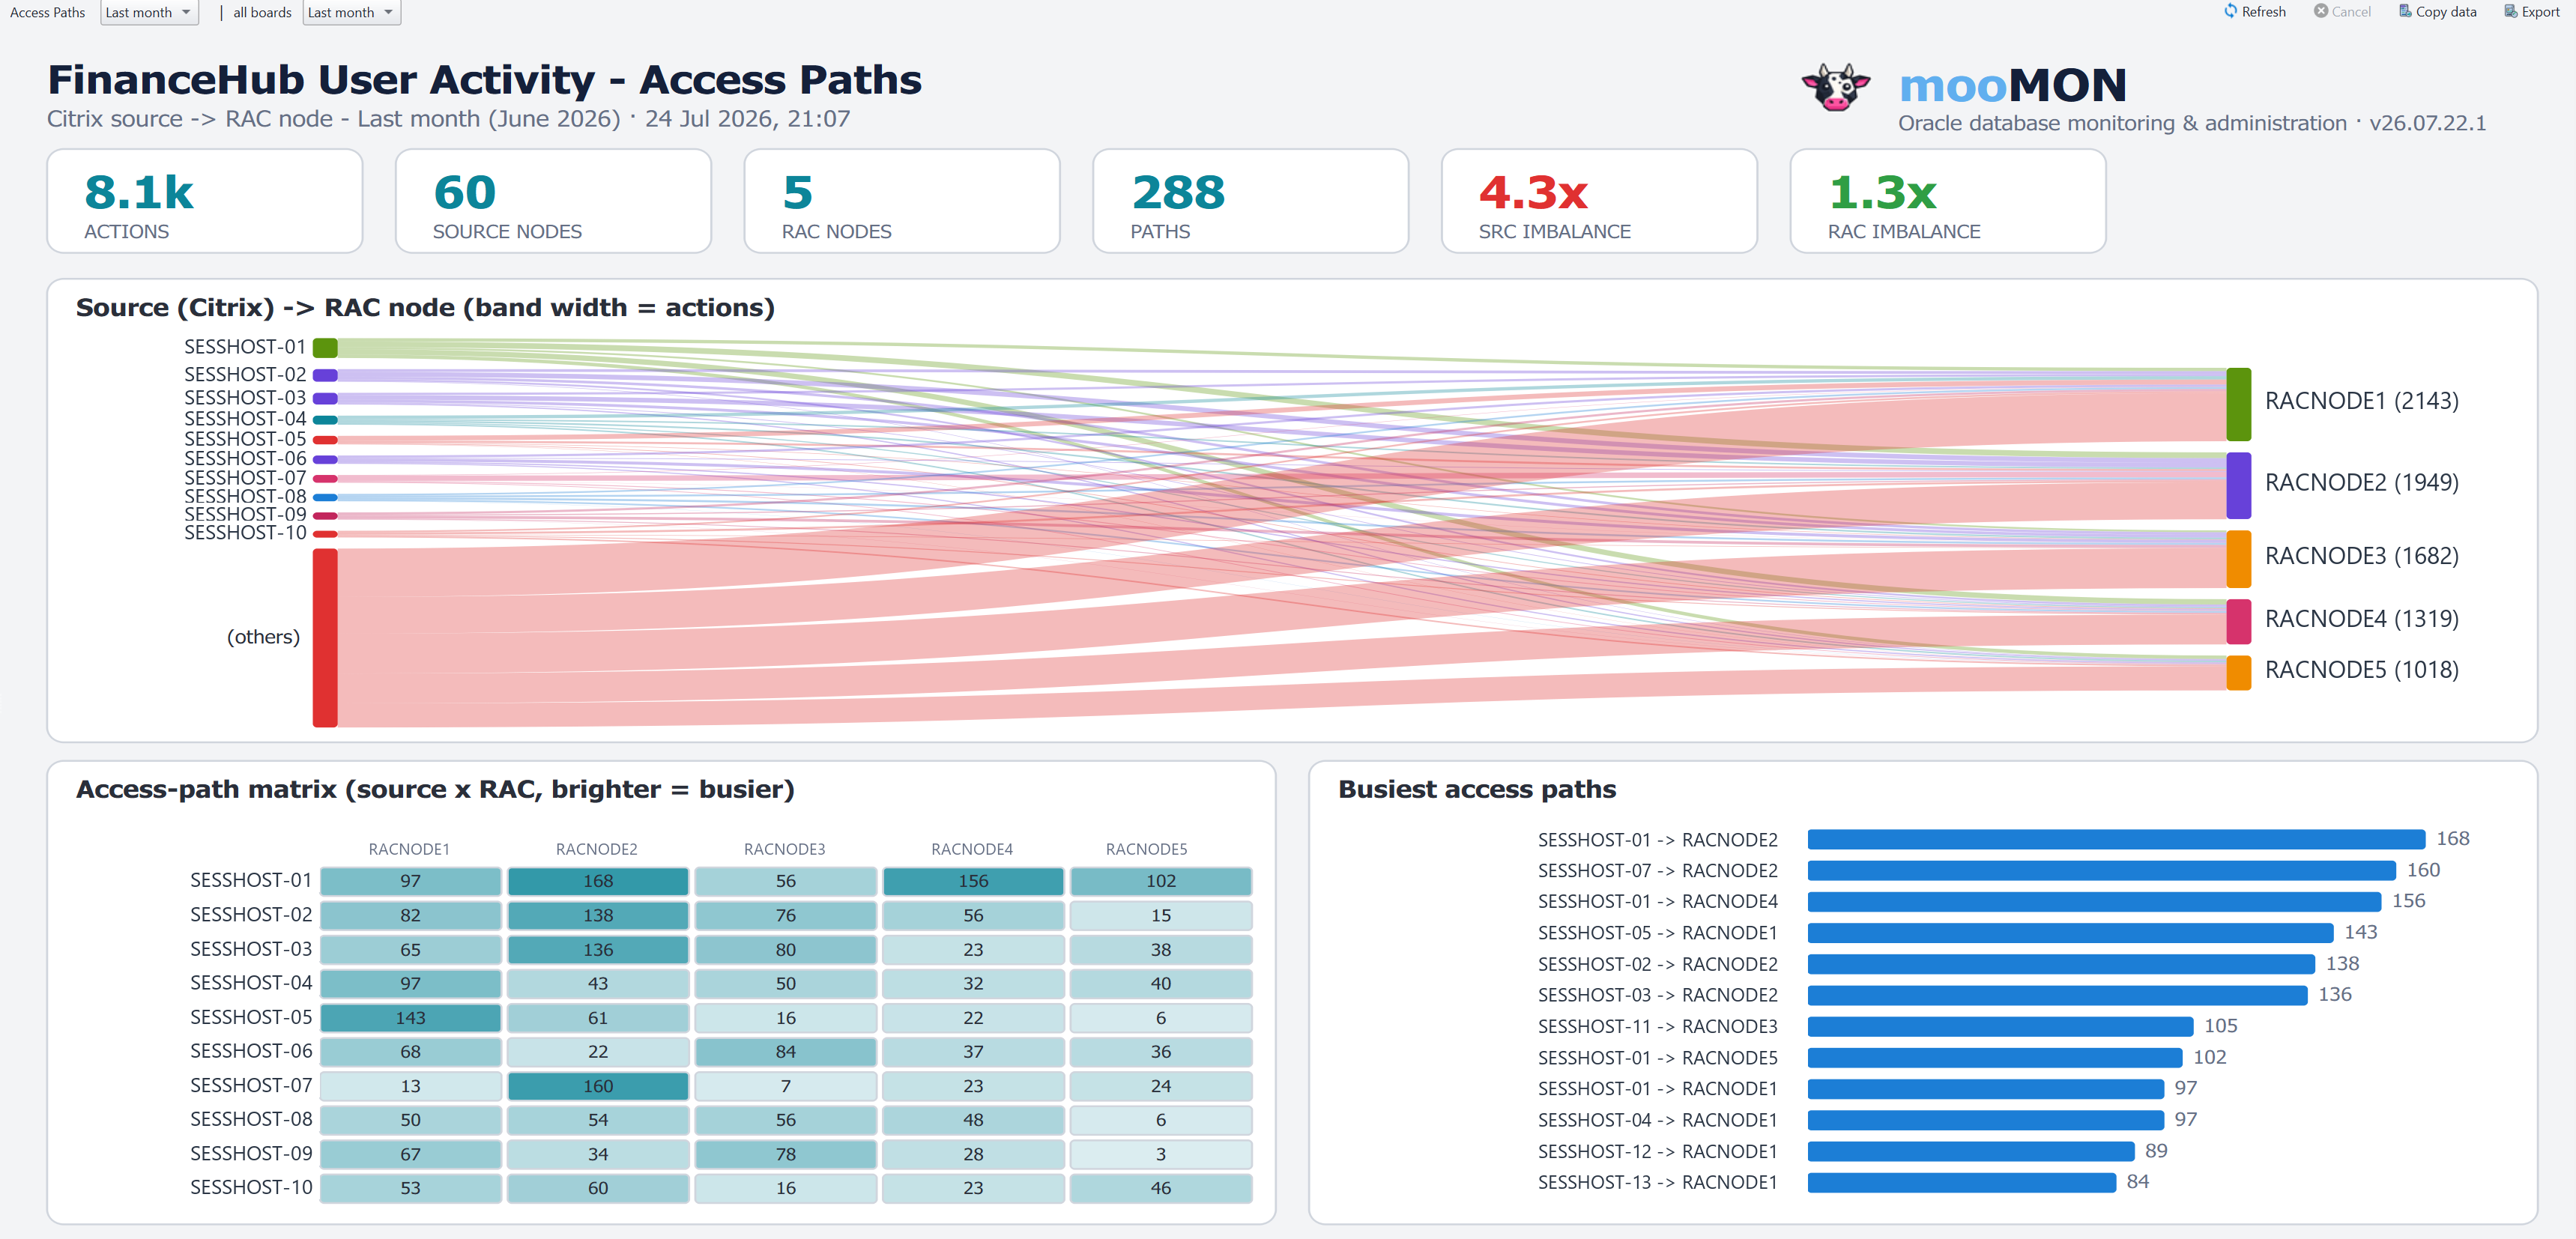
The Analytics dashboards go further — for example Access Paths traces user activity from session source to RAC node, so you can see how load is actually spread across the cluster, with imbalance ratios, a source×node matrix and the busiest paths called out.
Department Mapping
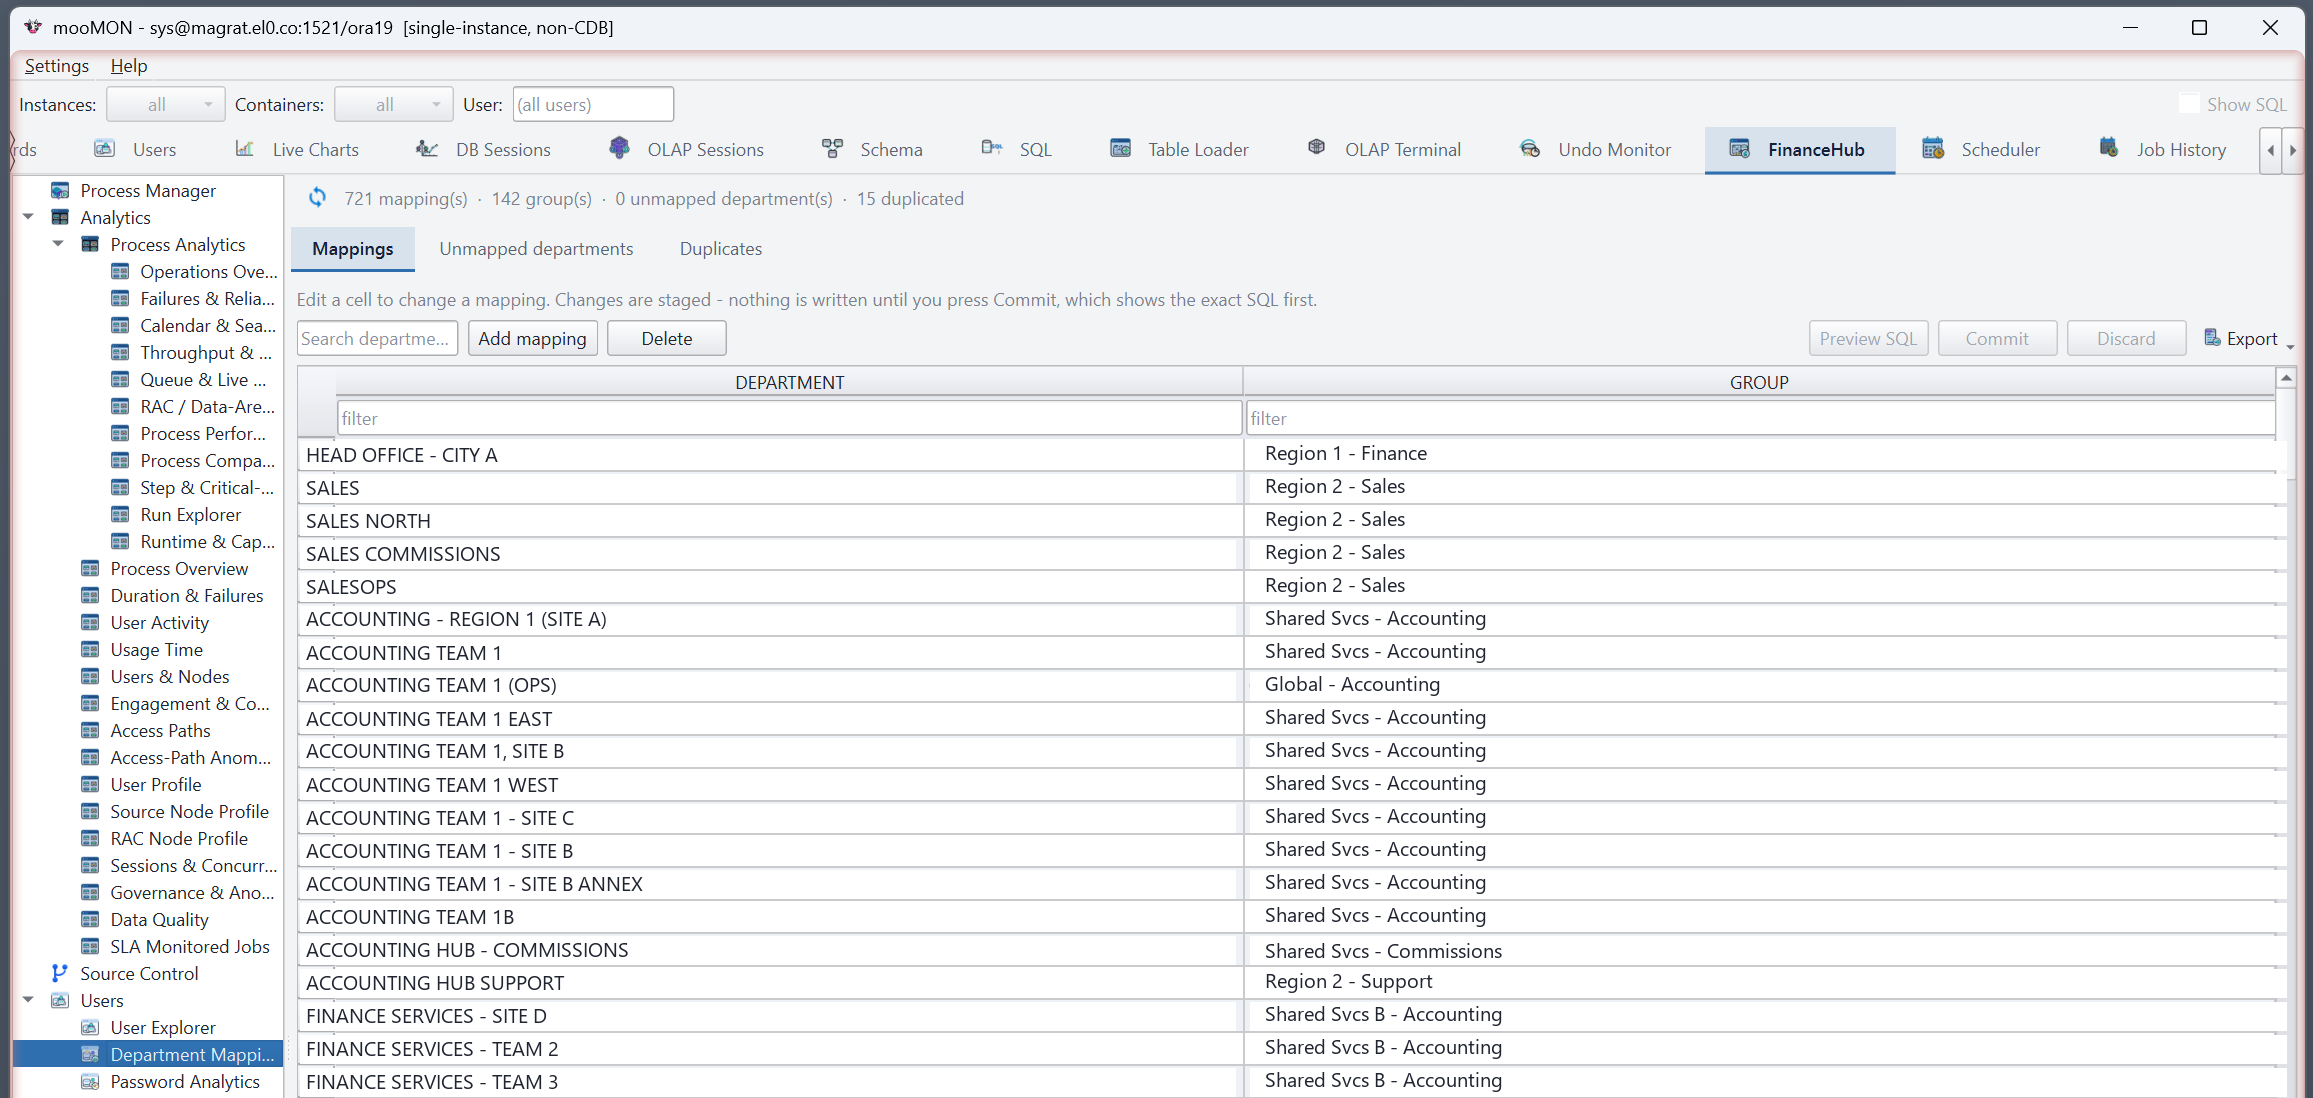
Under FinanceHub → Users, Department Mapping maintains the mapping from source departments to reporting groups. Edits are staged — Preview SQL, Commit, Rollback — and dedicated tabs list unmapped departments and duplicates.
View Explorer
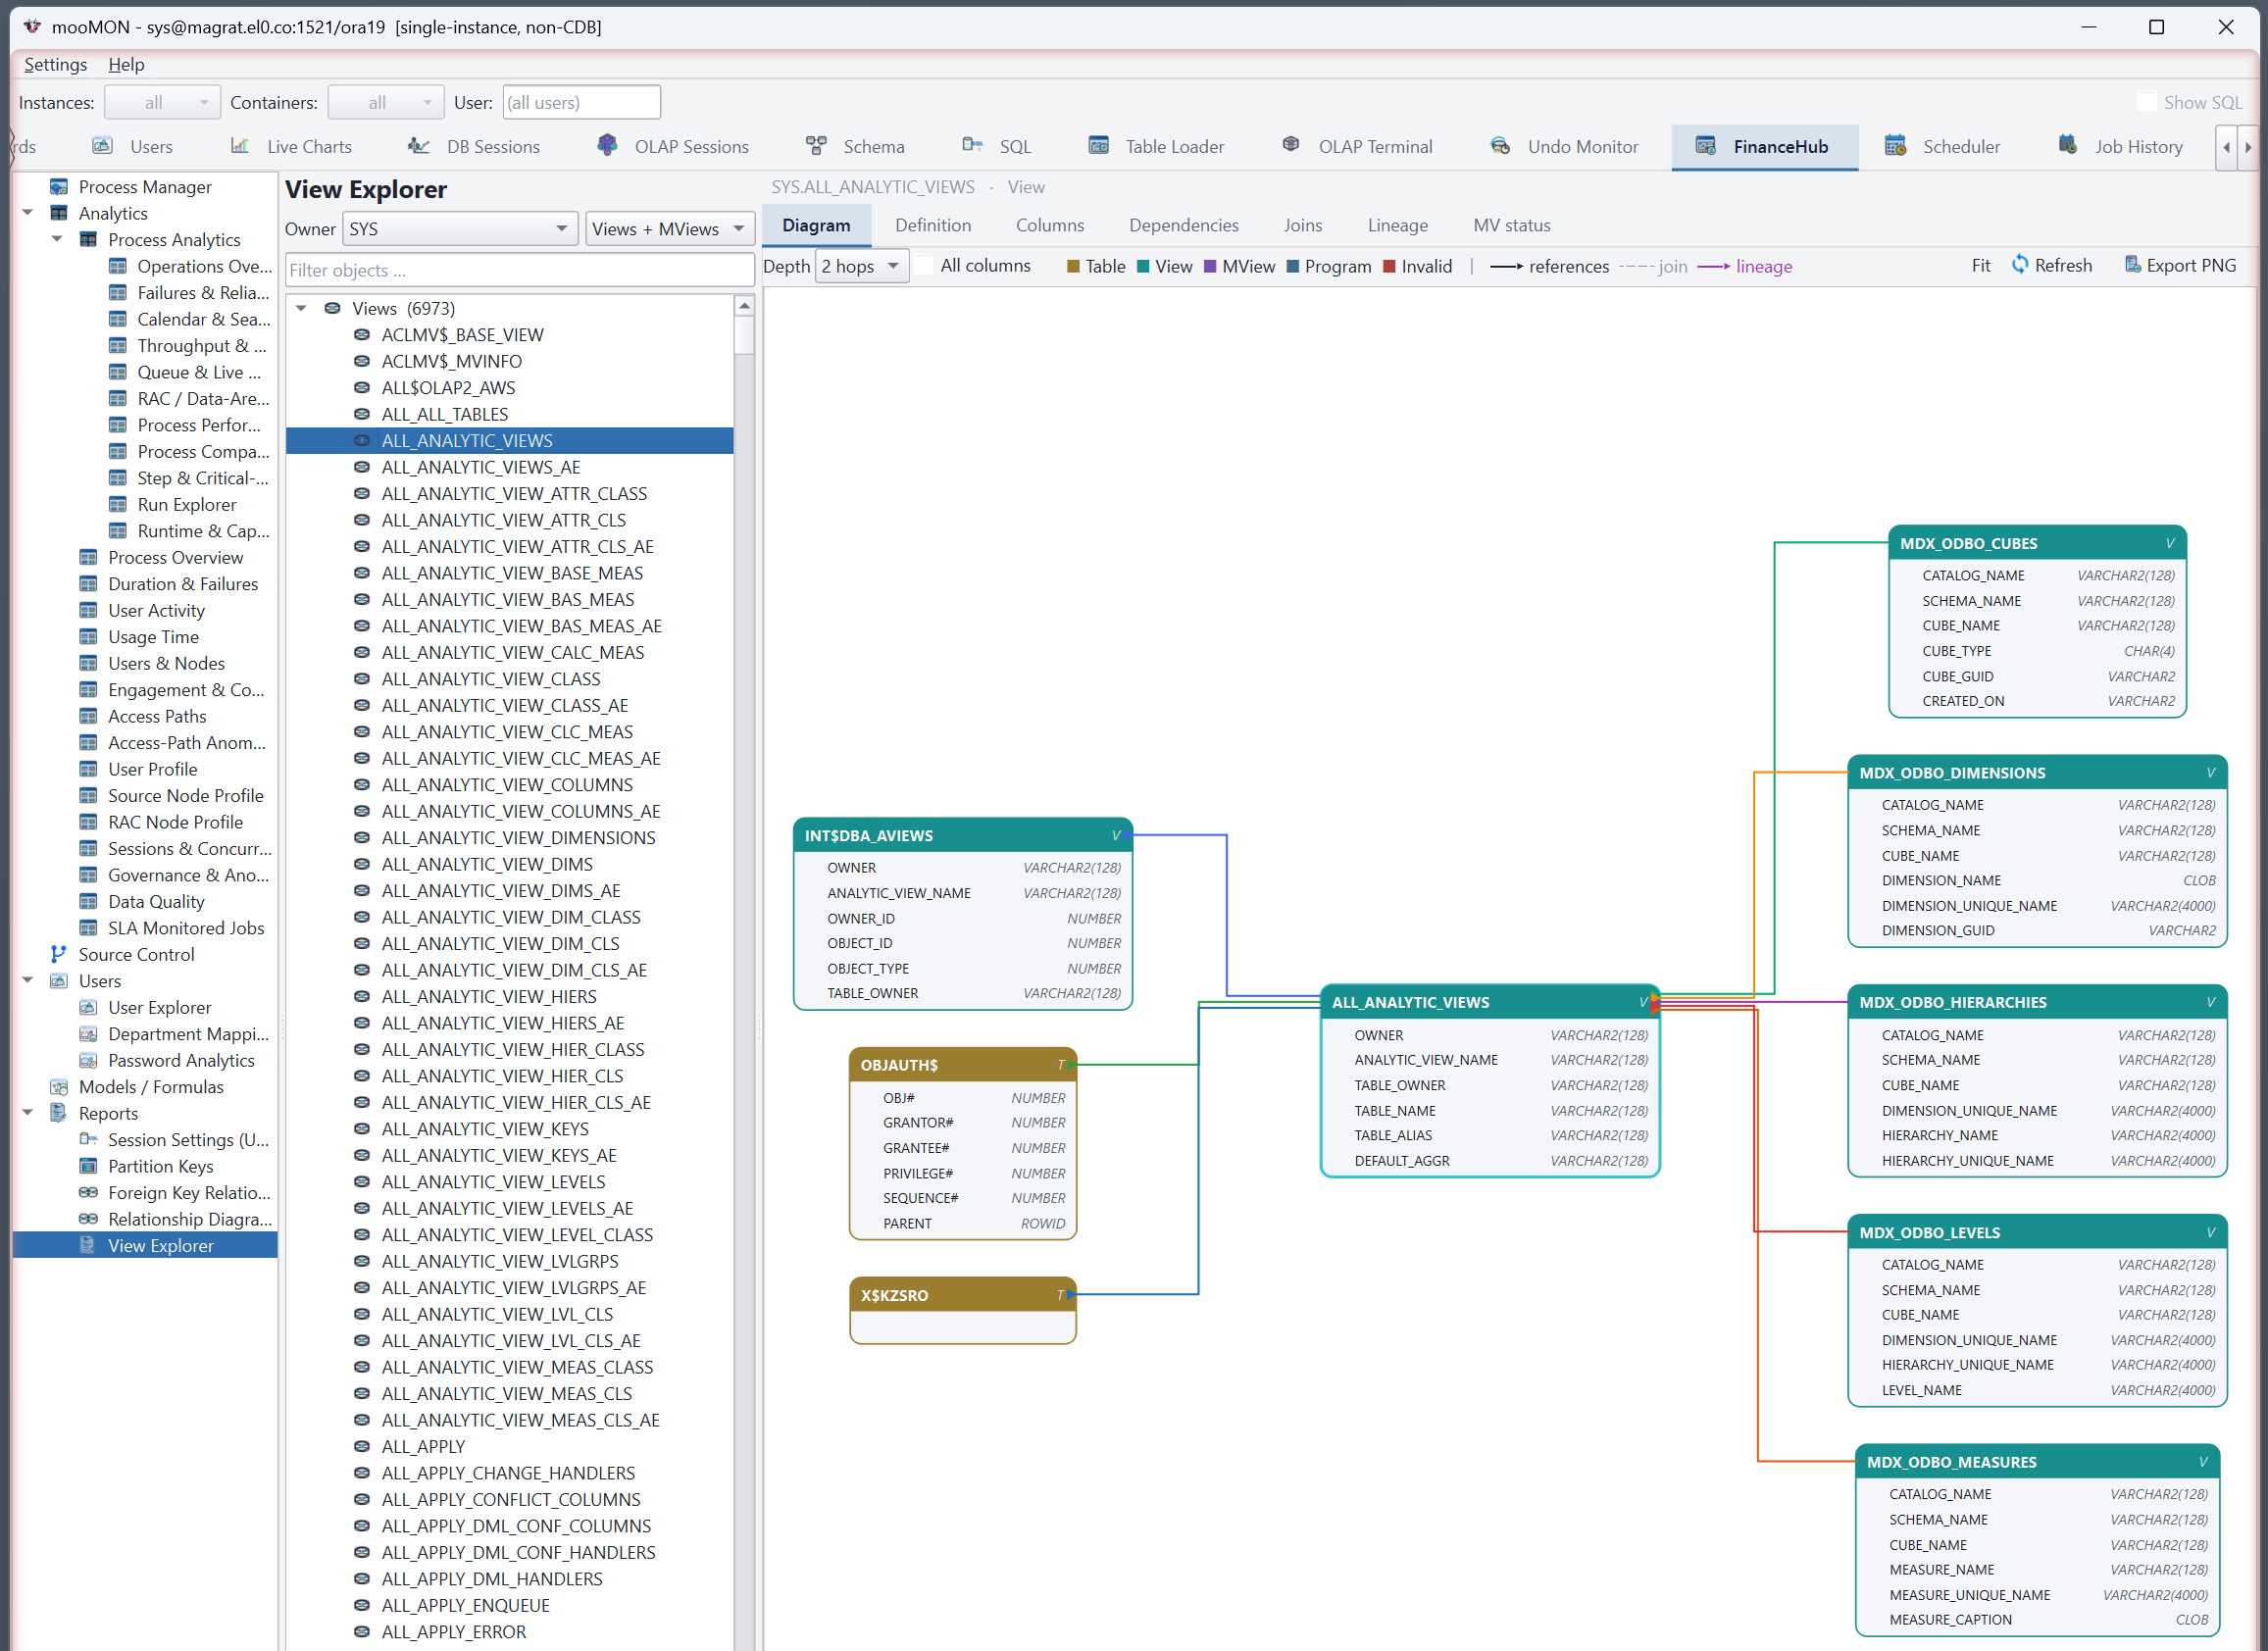
View Explorer maps how views relate: a diagram of a view and its neighbours, plus tabs for the Definition, Columns, Dependencies, Joins, Lineage and MV status — with column-level lineage derived by parsing the SQL.
Keyboard shortcuts
| Shortcut | Action |
|---|---|
| Ctrl+Enter | Run the current statement (SQL / OLAP) |
| Ctrl+Space | Open the completion popup |
| Ctrl+L | Jump to the command / entry box |
| F2 | Recall previous commands (OLAP terminal) |
| Ctrl+S | Save the current editor or script |
| Ctrl+G | Go to line |
| Ctrl+Shift+C | Copy the selection with column headers |
| Page Up / Page Down | Page through results and history |
Working with limited privileges
mooMON probes what your account can see when it connects, and adapts. If a login lacks the
catalog or V$ privileges a tab needs, that tab is disabled rather than throwing
errors, and where it can, mooMON falls back to the views you can see
(ALL_* instead of DBA_* / CDB_*). You get as much of the
tool as your grants allow, with a clear note on what's missing — ask your DBA for
SELECT_CATALOG_ROLE to unlock the monitoring views.
About & deployment
The version and credits are under Help → About. mooMON connects in thin mode and needs no Oracle client. It ships as a self-contained bundle for Windows, macOS and Linux, or runs from a source tree on locked-down hosts — see the Installation page for every option. It adapts to the privileges of the account you connect with, disabling tools it cannot run rather than failing.